
The Modern PostgreSQL Workflow: How Navicat and pgpulse Work Together to Build, Manage, and Operate PostgreSQL with Confidence
Database management and database observability solve different operational problems. Used together, Navicat and pgpulse create a clearer, safer PostgreSQL operations loop from design through recovery verification.
PostgreSQL has become the database of choice for organizations of every size. From fast-growing SaaS startups to global financial institutions, millions of applications rely on PostgreSQL every day to power mission-critical workloads.
However, as PostgreSQL adoption scales, so does operational complexity. Managing a production database today is no longer just about writing SQL queries or running schema migrations. It requires continuous visibility into health, rapid incident response, and the confidence to make changes without introducing risk.
This is where Database Management and Database Observability meet. While they solve different operational challenges, using them together creates a unified, highly efficient workflow.
In this article, we’ll explore how Navicat and pgpulse complement each other across the PostgreSQL lifecycle to help engineering teams build, operate, troubleshoot, and optimize their databases.
In one sentence: Navicat turns database decisions into action, while pgpulse turns live production telemetry into evidence, runbooks, validation steps, and recovery confidence.
The PostgreSQL Lifecycle Gap
Whether you are a DBA, backend engineer, or platform lead, your operational journey follows a distinct cycle:
- Design database schemas
- Develop & Optimize SQL
- Deploy changes to production
- Observe production performance
- Diagnose performance degradation
- Resolve incidents
- Verify system recovery
Trying to force a single tool to handle every step usually results in compromises. Hands-on management tools are not built for continuous telemetry aggregation, and observability platforms are not built for active schema administration.
The most effective teams use specialized tools that excel at specific stages of the lifecycle.
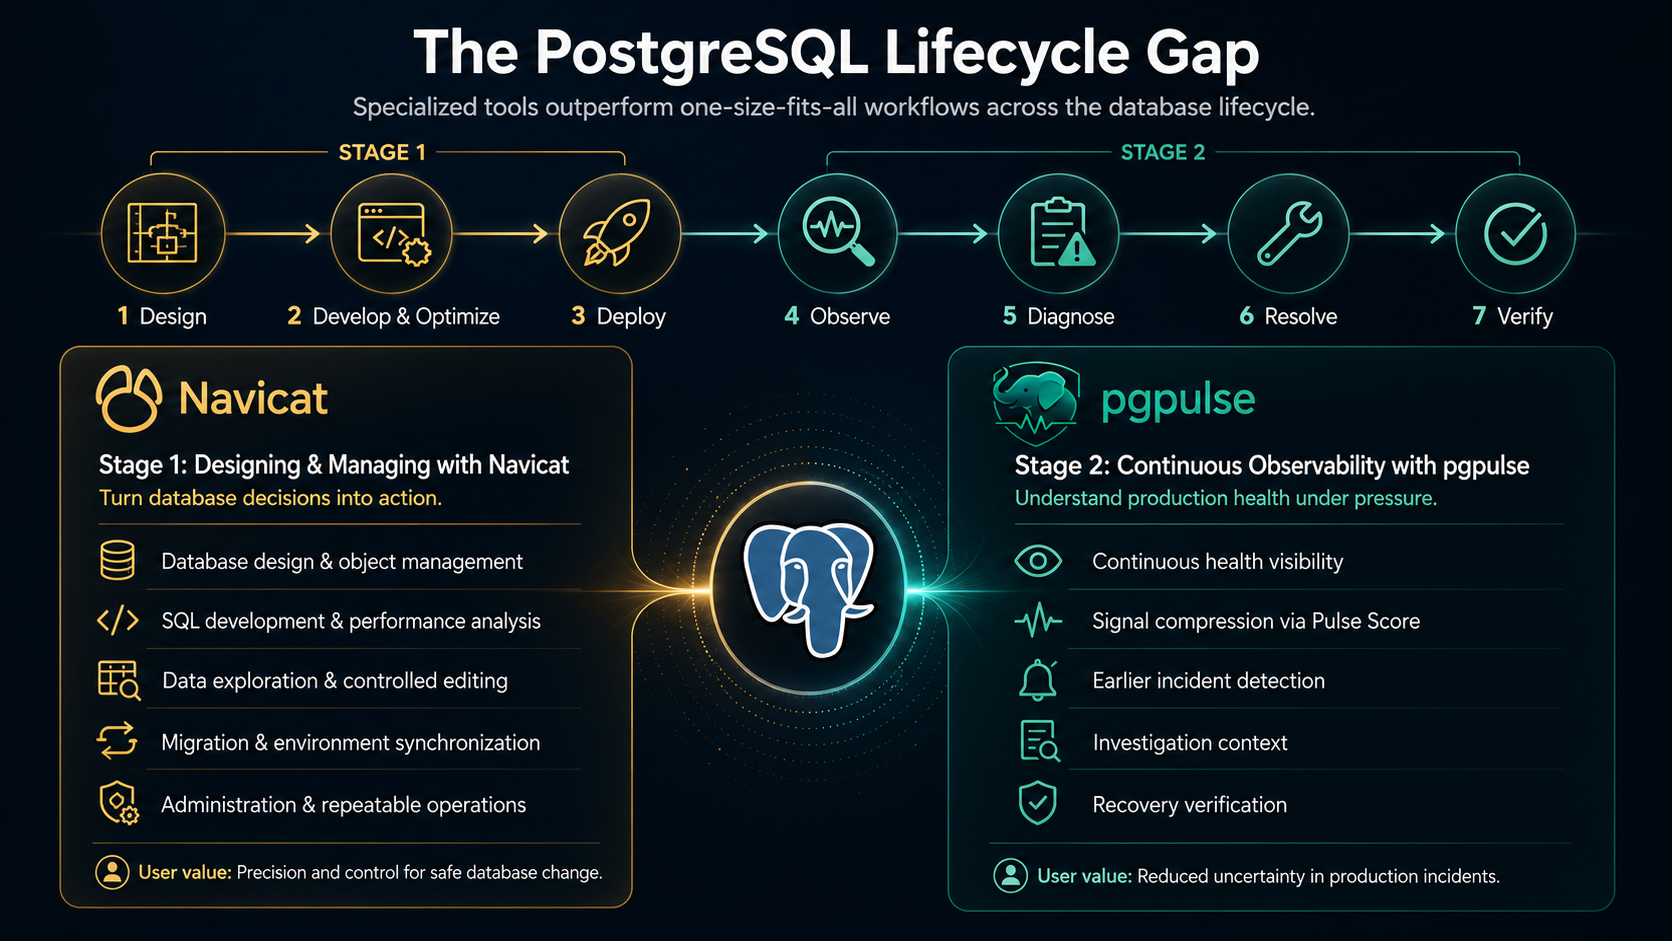
The published lifecycle split: Navicat leads design, development, and deployment; pgpulse leads observe, diagnose, resolve, and verify.
Stage 1: Designing & Managing with Navicat
Navicat is the hands-on workspace where engineers and DBAs design, develop, modify, migrate, and administer PostgreSQL through one integrated interface.
- Database design and object management: Create and modify tables, views, relationships, indexes, functions, and other database objects using visual designers and SQL-based workflows.
- SQL development and performance analysis: Write and test SQL with code completion, reusable snippets, a visual query builder, execution-plan visualization, and PL/pgSQL debugging.
- Data exploration and controlled editing: Browse, filter, profile, update, import, and export data when direct intervention or investigation is required.
- Migration and environment synchronization: Compare and synchronize database structures and data, transfer datasets between servers, and execute migration scripts with greater control.
- Administration and repeatable operations: Manage connections and users, perform backup and restore operations, and schedule recurring queries, transfers, synchronizations, and maintenance tasks.
User value: Navicat gives teams the precision and control required to safely turn database decisions into action.
Stage 2: Continuous Observability with pgpulse
pgpulse is the interpretation layer for production PostgreSQL. It helps teams understand engine health without manually stitching together disconnected metrics and internal views.
- Continuous health visibility: Watch health domains such as lock contention, connection pressure, vacuum, bloat, replication, WAL, memory fit, and throughput.
- Signal compression: Turn many technical indicators into a clear health picture through the Pulse Score and domain-level evidence.
- Earlier incident detection: Surface degradation before it becomes a prolonged outage or customer-facing emergency.
- Investigation context: Preserve findings, event history, and runbook-style guidance so responders start with evidence instead of guesswork.
- Recovery verification: Confirm that a fix improved health instead of only masking symptoms.
User value: pgpulse reduces uncertainty when the database is under real production pressure.
A Production Incident Workflow: Navicat + pgpulse in Action
To see how these two platforms work together, supported by structured runbooks and controlled remediation workflows, consider a production incident.
The Scenario: Connection Pressure Reveals a Broader Database Emergency
A production PostgreSQL instance begins showing signs of severe operational stress.
Application requests slow down, new database connections become difficult to establish, and the engineering team initially suspects a conventional connection-pool or workload problem.
However, the telemetry reveals that connection exhaustion is only one part of a much broader incident.
At the same time, the database is showing signals related to:
- Administrative connection pressure
- Transaction ID wraparound risk
- Worker saturation
- WAL pipeline stress
- Archive recovery failure
- A retained replication slot
- Durability configuration
- Possible storage-integrity problems
This is not a situation where the team should immediately increase max_connections, terminate random sessions, or restart PostgreSQL.
The incident requires structured validation before any disruptive action is taken.
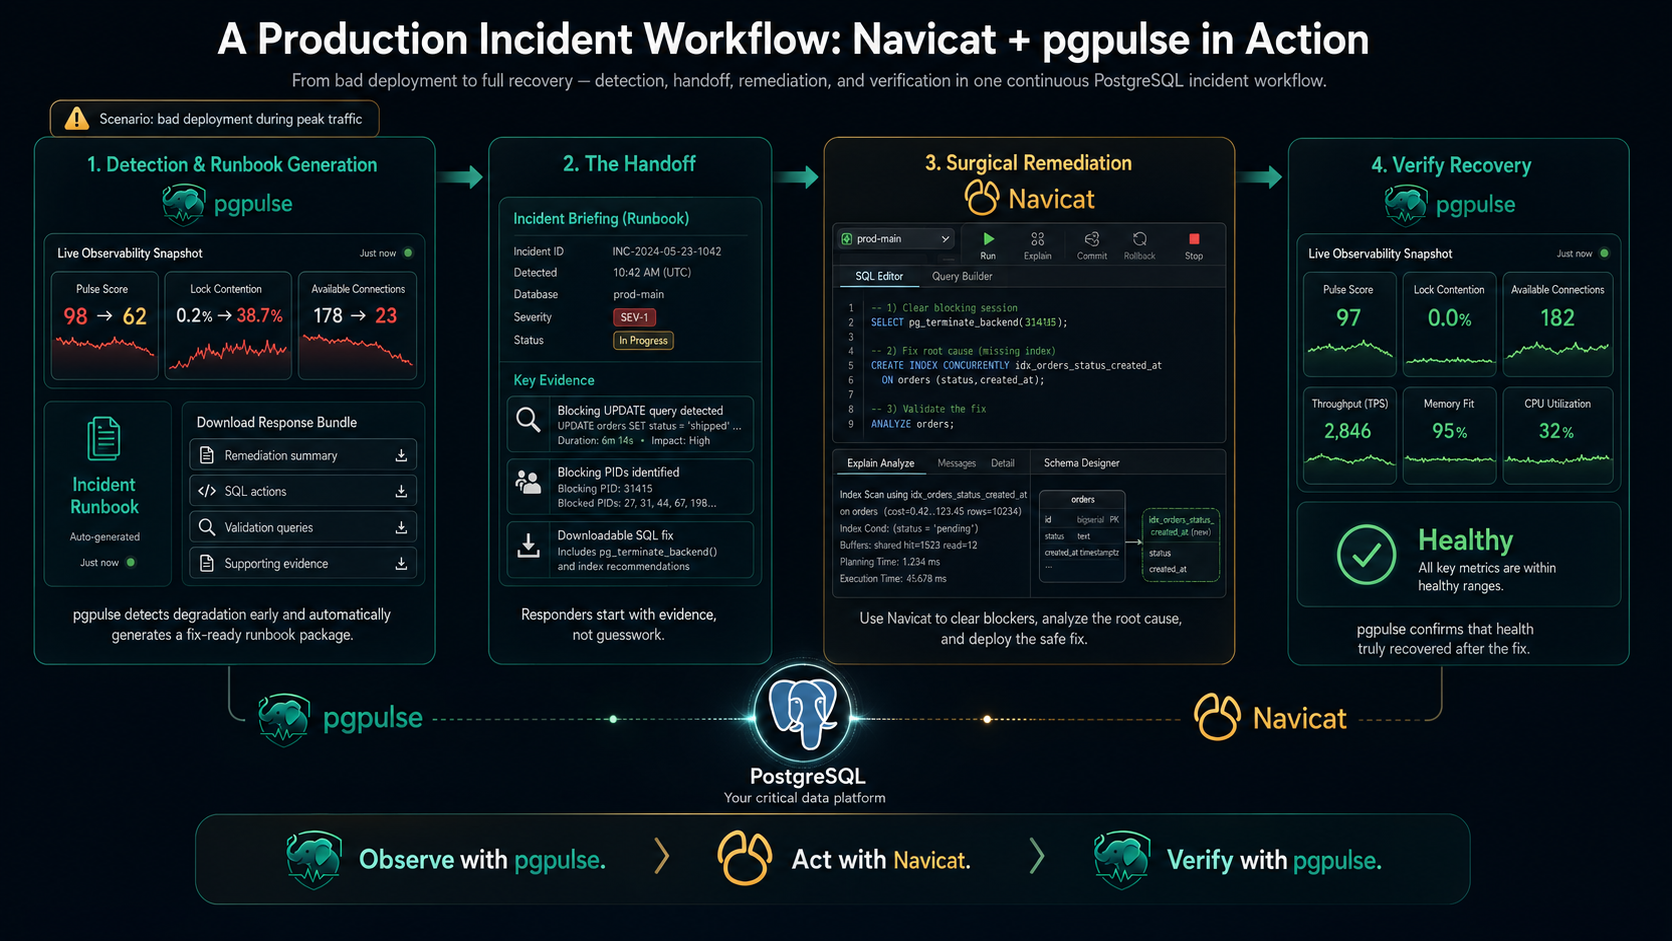
The full incident loop in the published article: detect and package in pgpulse, remediate in Navicat, then verify recovery in pgpulse.
Step 1: Detect the Degradation with pgpulse
Instead of waiting for application symptoms to become a complete outage, the on-call engineer opens pgpulse.
The Pulse Score has fallen from a healthy range to 61, indicating that the database requires immediate investigation.
The main Pulse view immediately shows that several domains and gates require attention.
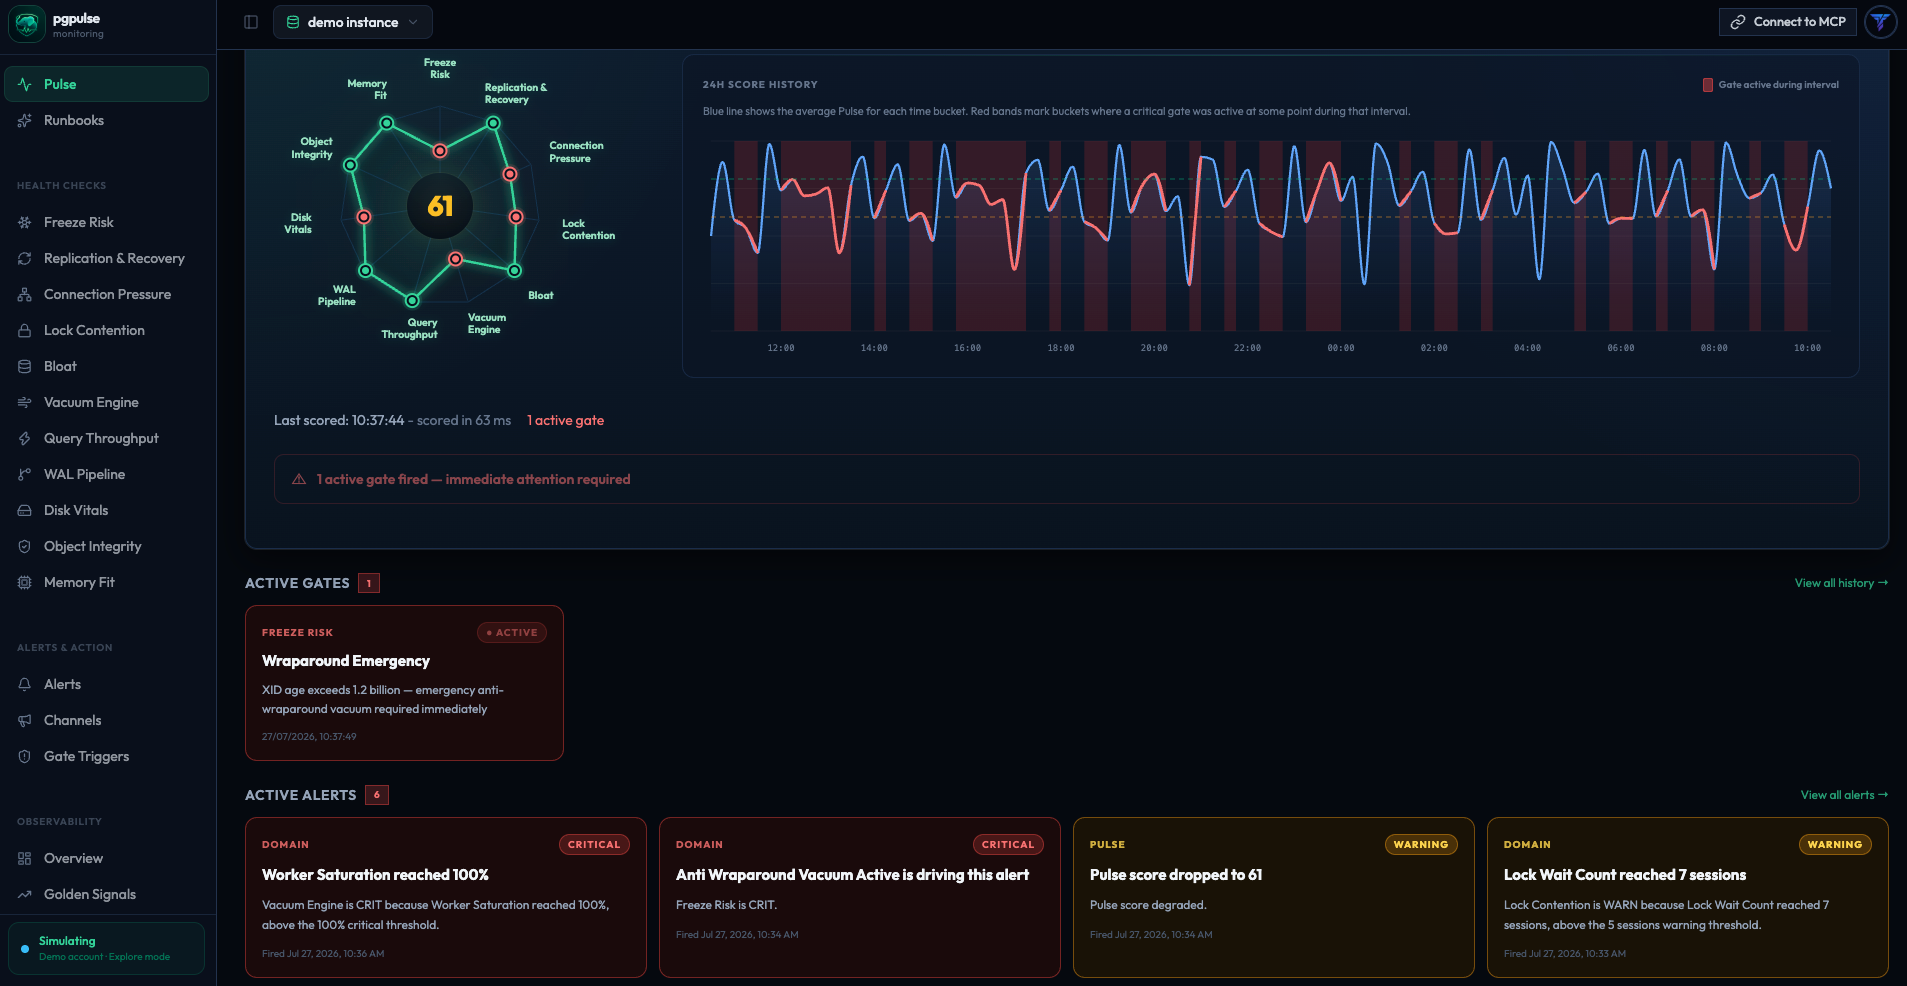
The degraded Pulse view surfaces the incident immediately through score, domain, gate, and alert context.
Among the visible warnings are conditions related to:
- Freeze Risk
- Worker saturation
- Wraparound-related vacuum activity
- Lock waits
- Connection pressure
- WAL pipeline degradation
The WAL Pipeline view provides additional evidence.
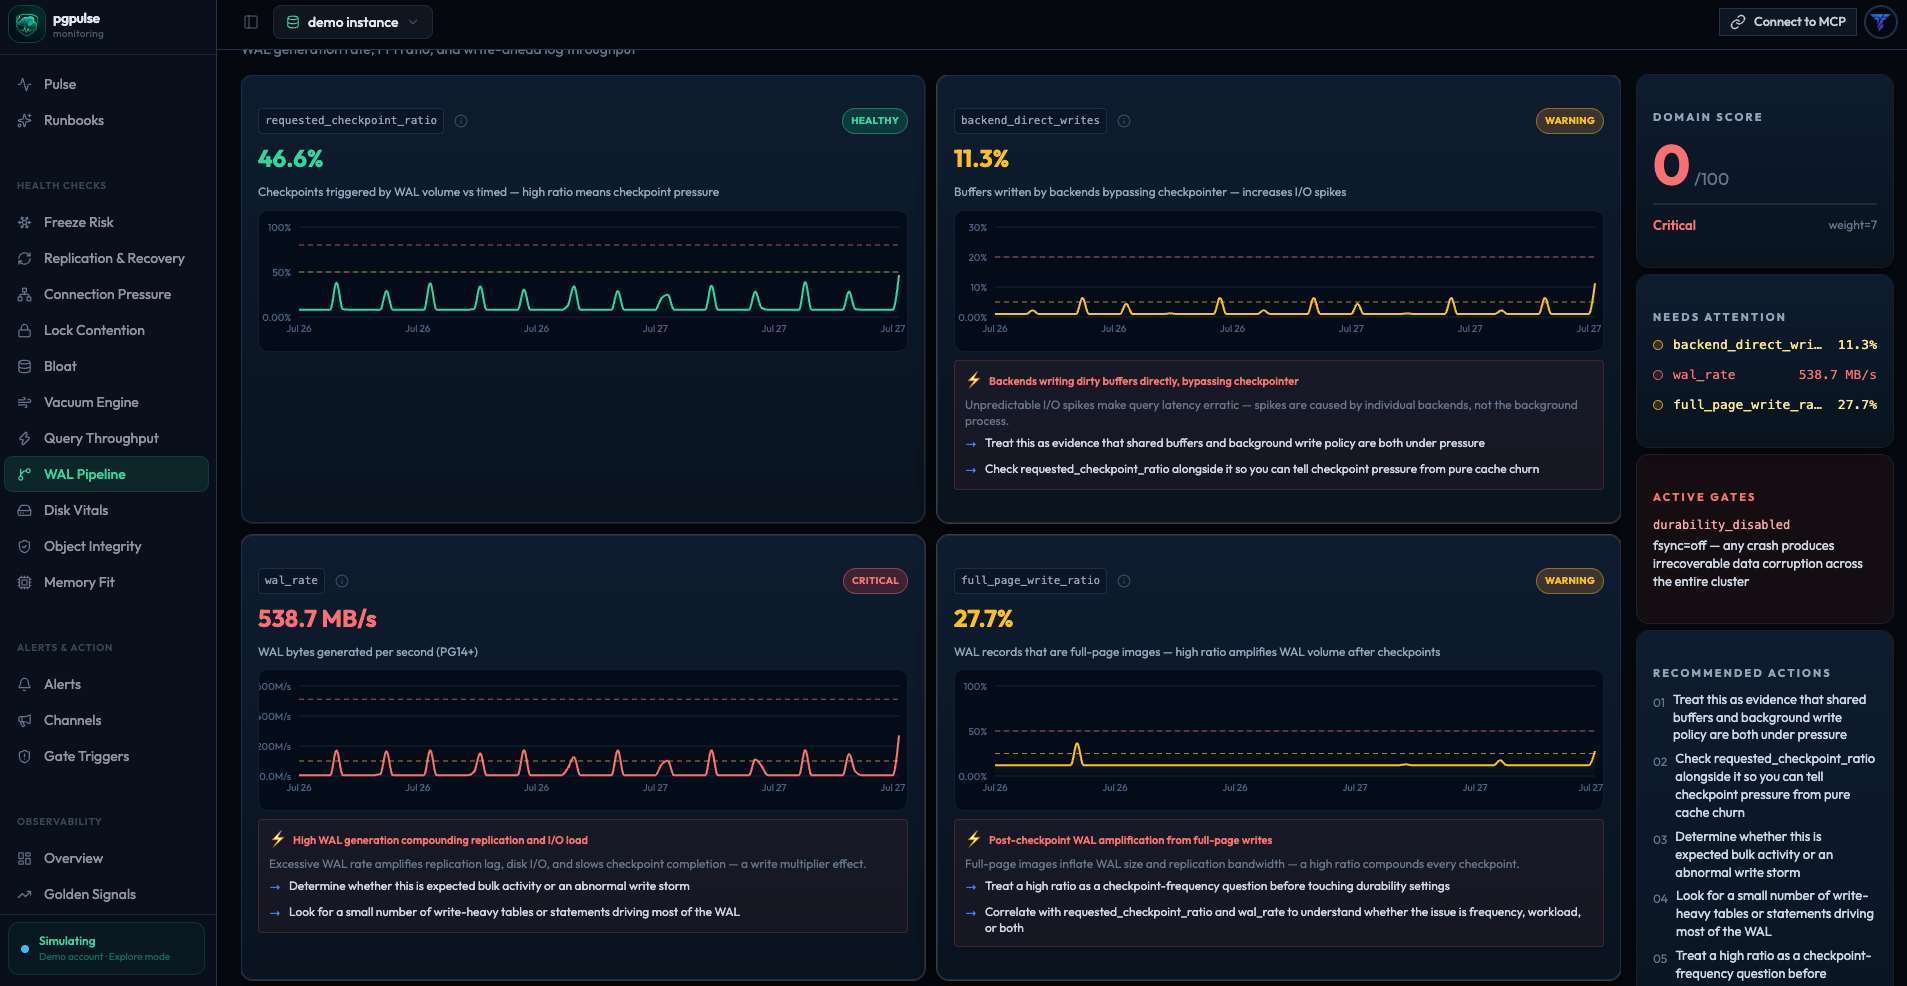
pgpulse shows the related WAL signals together so the operator sees the pattern, not just one spike.
Rather than displaying only one abnormal metric, it shows several related indicators together, such as:
- Checkpoint activity
- Backend direct writes
- WAL generation rate
- Full-page write ratio
- Domain-level recommendations
- Active safety gates
This is important because an isolated metric can be misleading.
A high WAL rate, for example, may be expected during a migration or bulk operation. But a high WAL rate combined with archive failure, retained WAL, durability concerns, and recovery-related gates requires a very different response.
pgpulse therefore presents the incident as a broader PostgreSQL health problem rather than a single performance spike.
Step 2: Generate and Review the Incident Runbook
Because critical conditions are active, pgpulse generates an incident runbook titled:
Active connection pressure with multiple hard safety gates and storage integrity risk
The runbook does not claim that connection exhaustion is the only root cause.
Instead, it summarizes the incident as a compound failure state.
The database may be under connection pressure, but the same telemetry snapshot also contains evidence of potentially more serious conditions involving durability, recovery, storage integrity, WAL retention, and transaction ID safety.
The runbook records important incident metadata such as:
- Incident class
- Urgency
- Telemetry freshness
- Confidence level
- Number of open alerts
- Number of active gates
- Runbook version
This prevents responders from interpreting an uncertain diagnosis as an established fact.
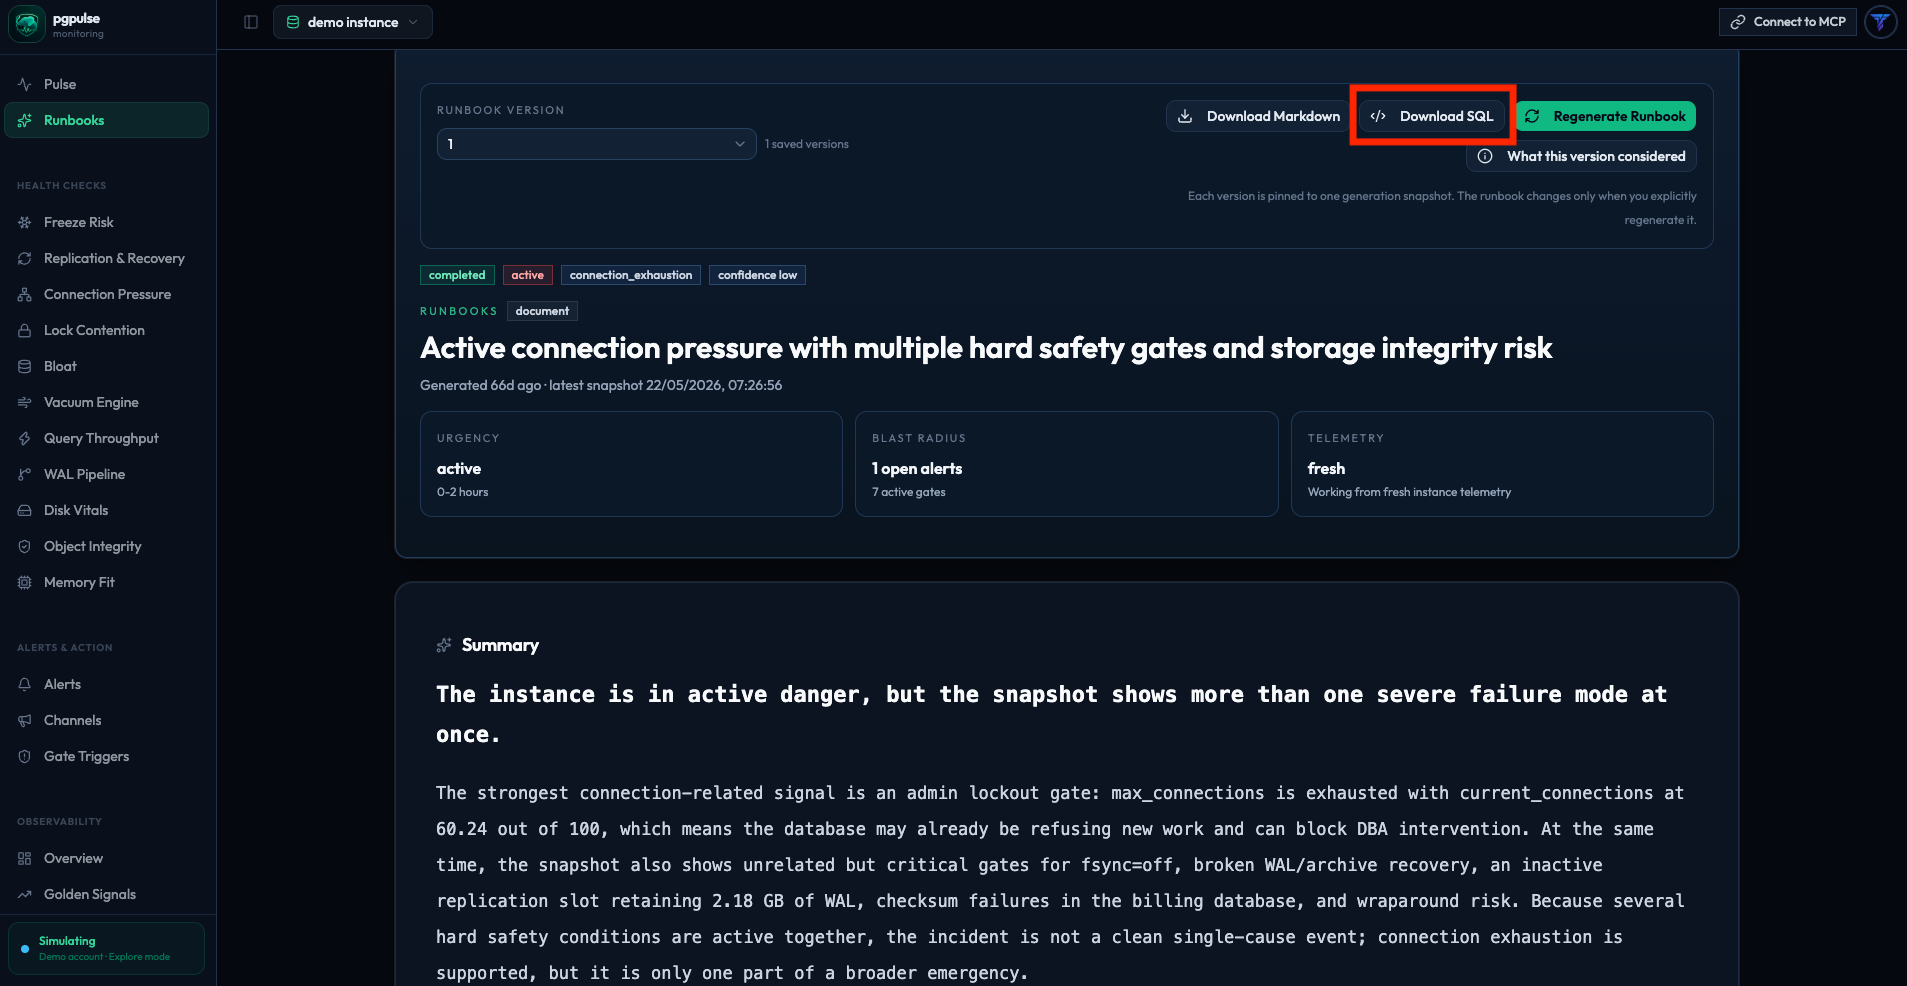
The runbook packages the incident into a reviewable brief and downloadable response bundle.
Reviewing the Runbook
Instead of starting an investigation from scratch, the on-call engineer opens the newly generated runbook. It acts as an immediate incident briefing by summarizing the failure state, supporting evidence, and recommended validation path.
The runbook makes it clear that the incident is not a simple connection-capacity problem. Increasing max_connections, terminating sessions, or restarting PostgreSQL without further validation could hide the symptoms while leaving more serious durability or recovery risks unresolved.
Key Observations
The runbook highlights several important findings:
- Connection pressure is real, but it is not the only emergency. The instance is experiencing administrative connection pressure, but the same snapshot also contains additional critical conditions. The operator should therefore avoid assuming that increasing the connection limit will resolve the incident.
- The instance is already in a safety-critical state. Multiple hard gates are active, including conditions associated with durability, archive recovery, transaction ID wraparound, WAL retention, and storage integrity. This means the incident requires careful validation before any disruptive action is taken.
- The billing database requires focused validation. Integrity-related evidence and transaction ID risk are associated with the billing database, making it an important investigation target.
- WAL retention and archive recovery may also be involved. The snapshot indicates that an inactive replication slot may be retaining WAL while archive failures are continuing. Together, these conditions can threaten disk capacity and recoverability.
These observations establish the scope of the incident. The runbook then converts them into a prioritized set of validation steps.
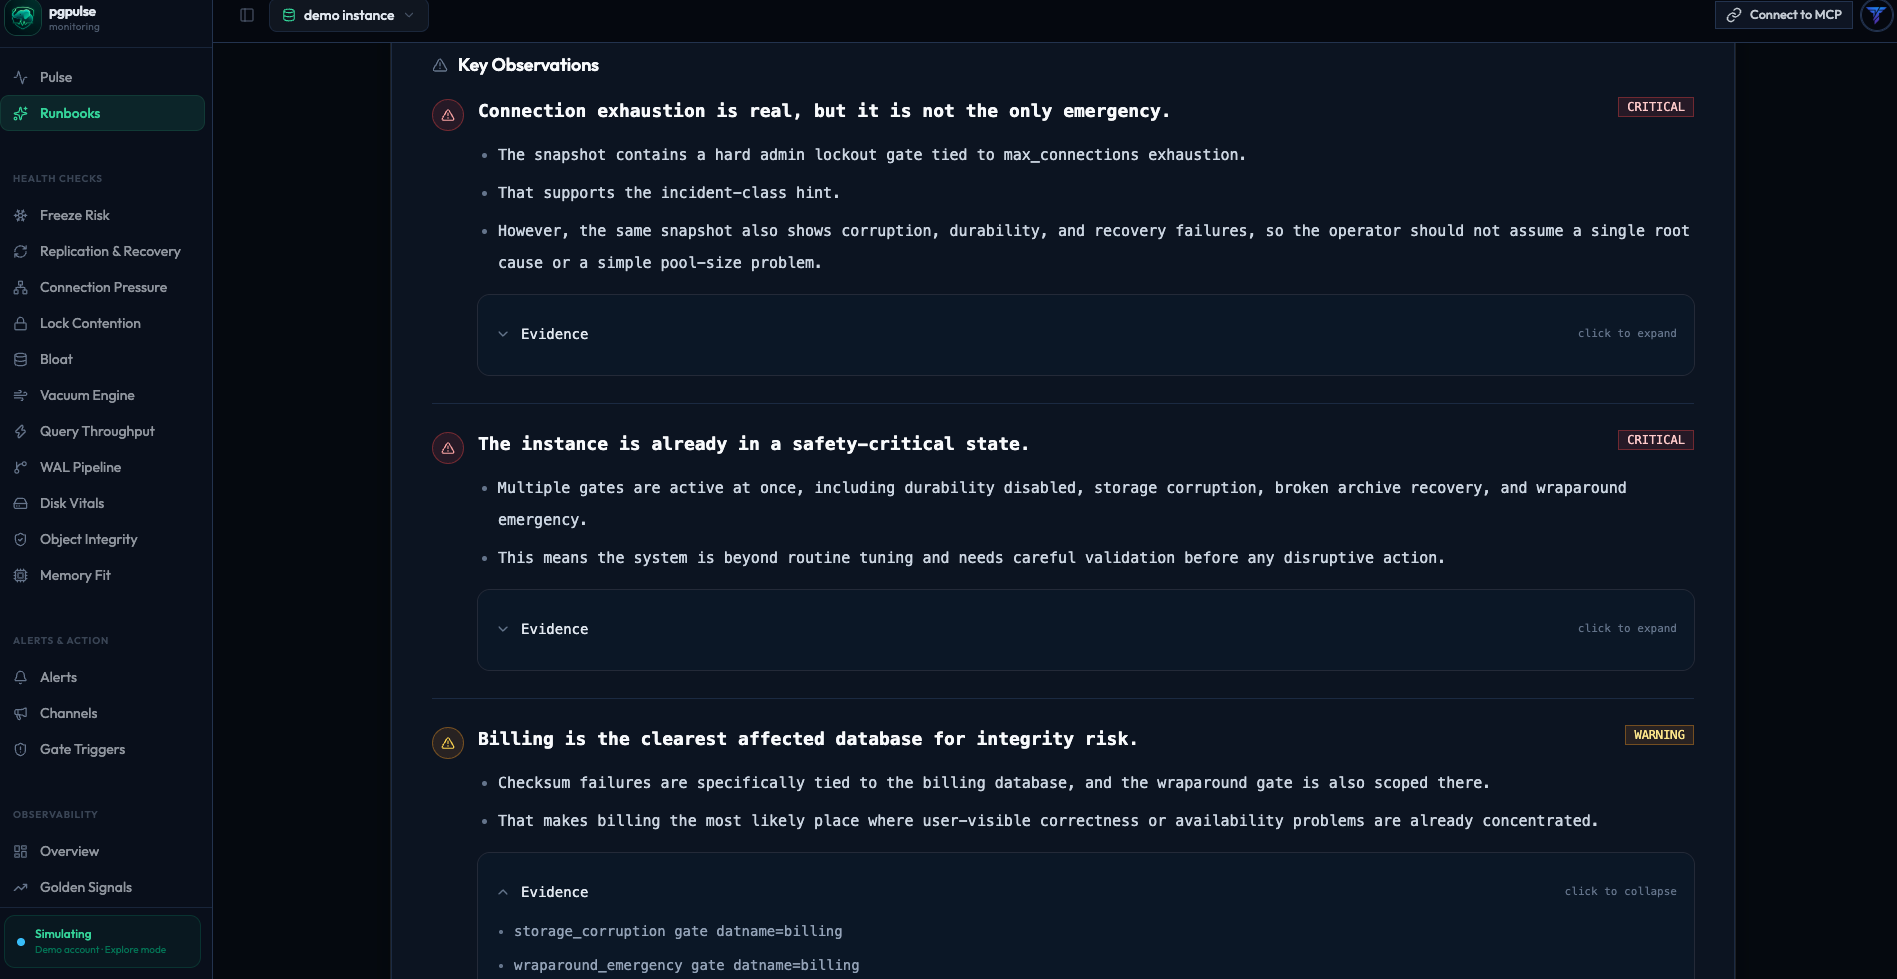
The runbook keeps connection exhaustion in context instead of letting it overshadow the more serious safety conditions.
Actionable Insights and Validation Queries
The runbook translates its key observations into a prioritized investigation path. It tells the operator what should be validated first, why each check matters, and how the results should be interpreted.
For this incident, the recommended investigation may include:
- Measure current session pressure and compare it with
max_connections. - Identify active, waiting, and idle-in-transaction sessions.
- Check transaction ID age in the affected database.
- Verify whether an inactive replication slot is retaining WAL.
- Confirm whether archive failures are still occurring.
- Validate durability and storage-integrity conditions before taking disruptive action.
Each recommendation includes the supporting evidence, a reviewable validation query, expected result interpretation, and, where applicable, a conditional action path.
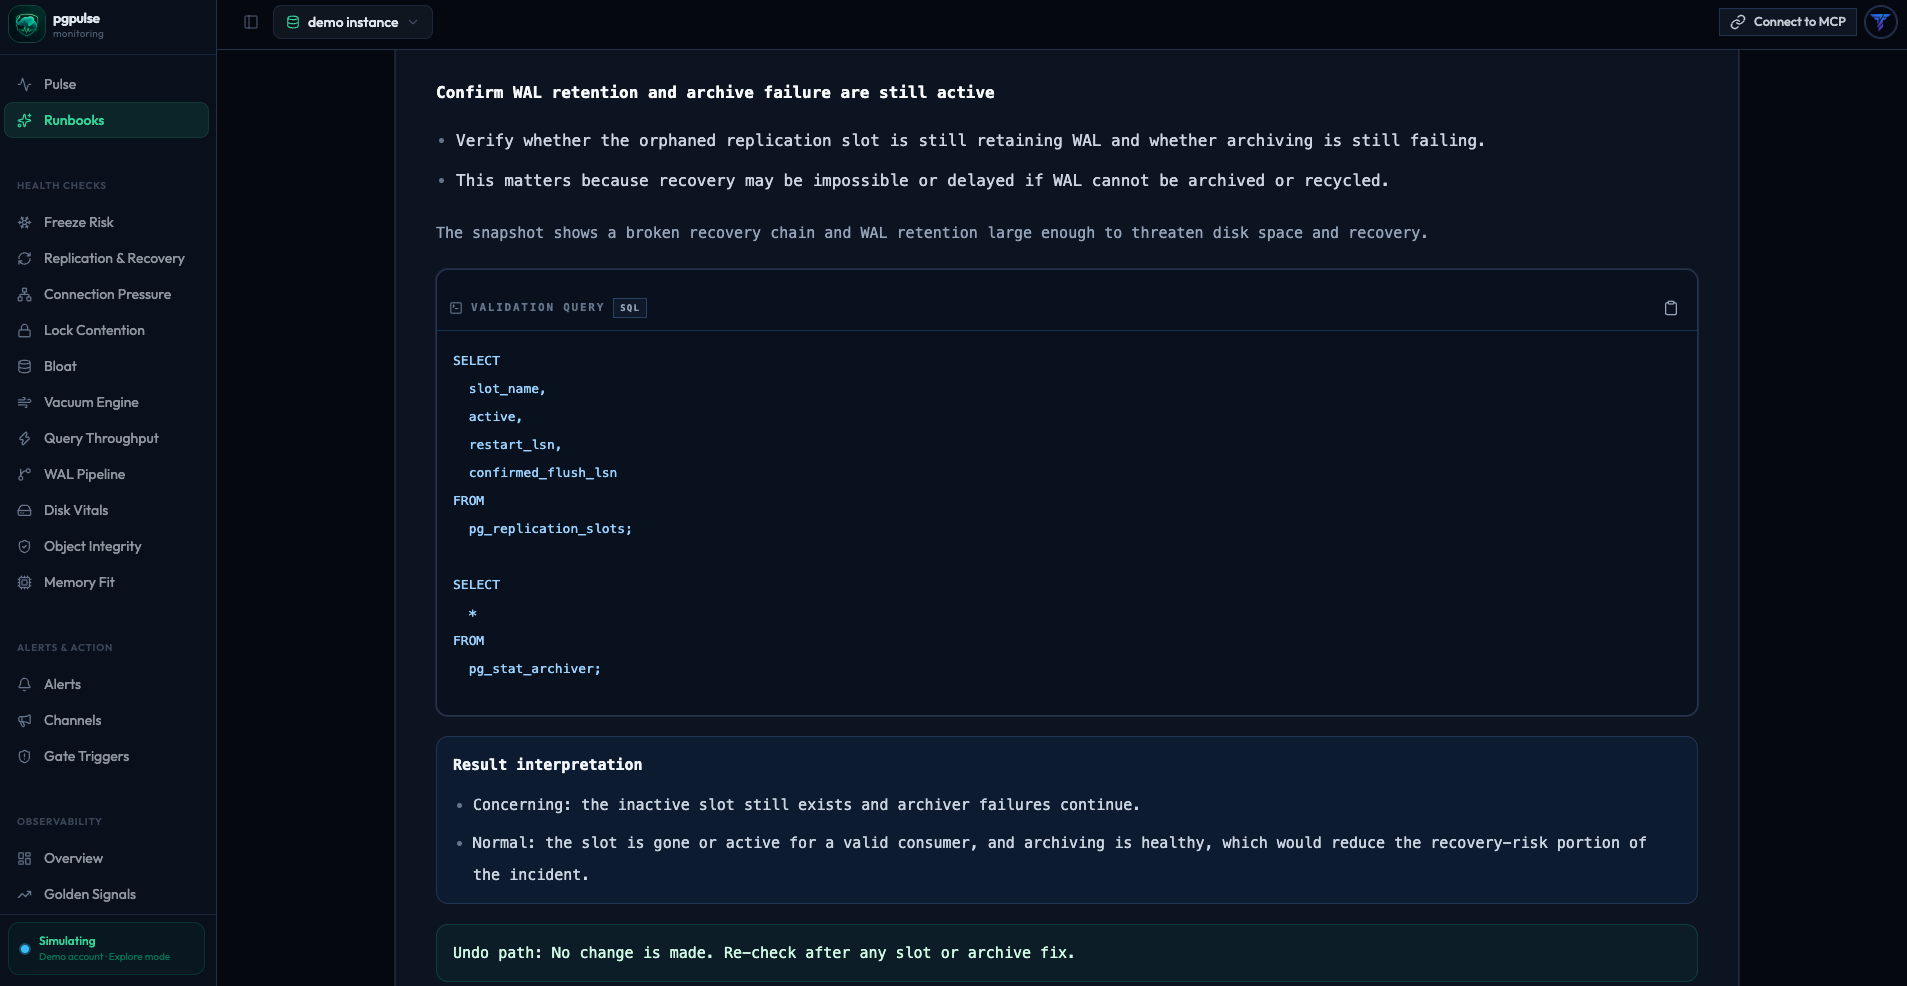
Validation queries stay tied to evidence and interpretation, which keeps the investigation reviewable under pressure.
Downloading the Response Bundle
pgpulse allows the engineer to download a SQL response bundle from the generated runbook.
The purpose of this file is not to execute destructive remediation automatically.
Instead, it provides a structured and reviewable investigation plan.
The downloaded SQL can include:
- Runbook metadata
- Incident classification
- Confidence level
- Telemetry freshness
- Risk level for each step
- Reversibility information
- Read-only validation queries
- Result interpretation
- Conditional action paths
Each statement can be reviewed before it is executed.
This is particularly important during an incident involving several safety gates. Automatically terminating sessions, dropping replication slots, changing durability settings, or forcing vacuum operations without validation could make the situation worse.
Step 3: Validate and Act with Navicat
With the incident understood and the investigation path clearly defined, the engineer opens the downloaded SQL response bundle in Navicat’s Query Editor.
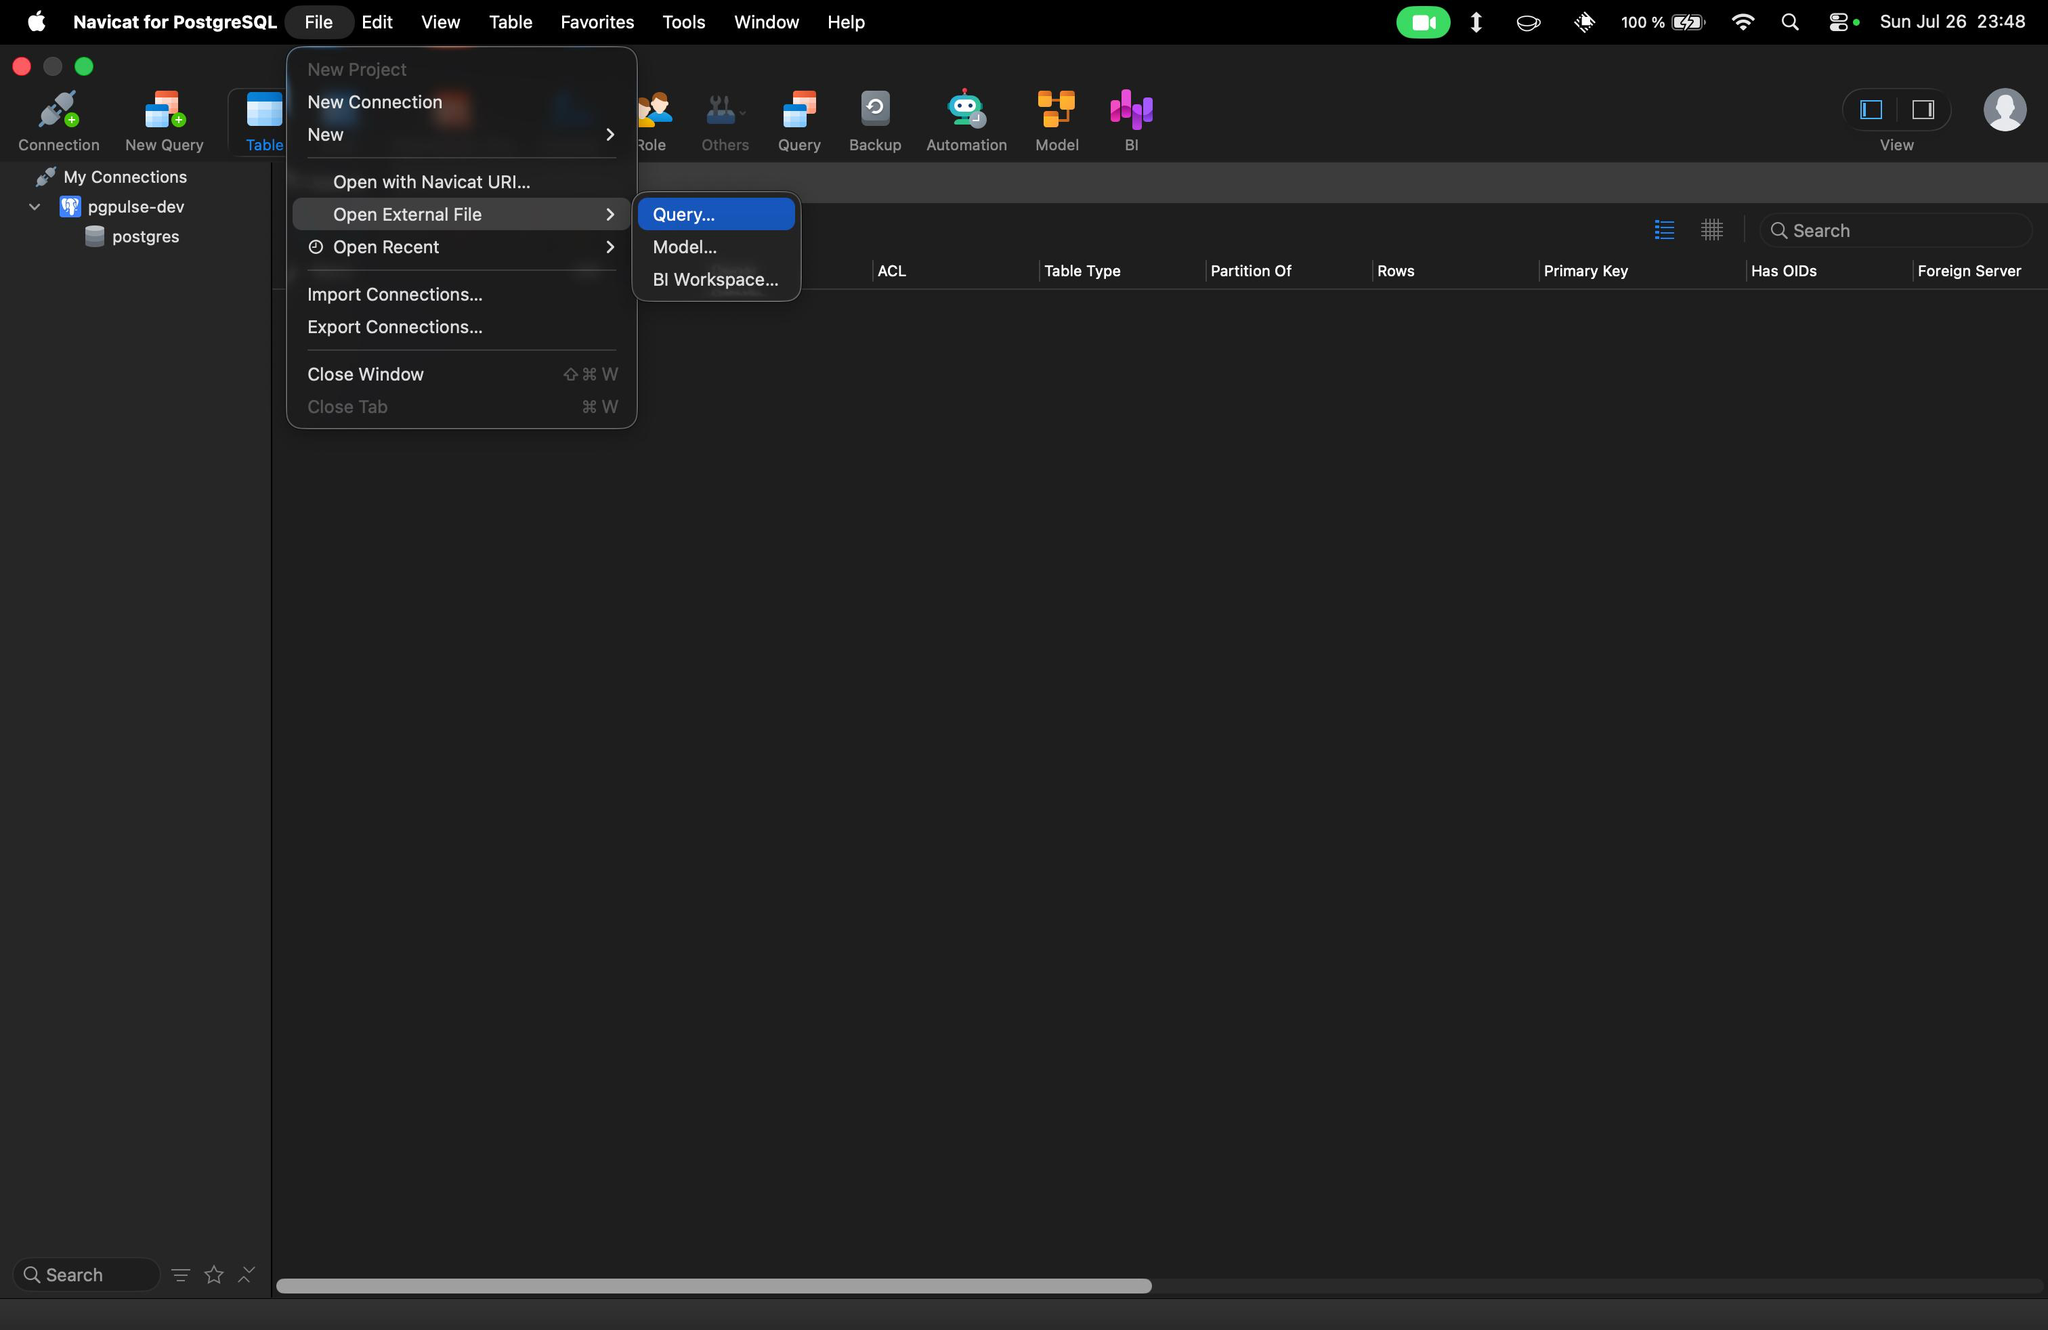
Navicat becomes the review and execution workspace once the runbook has narrowed the problem.
Using Navicat, the operator can validate:
- Current session pressure against
max_connections - Active, waiting, and idle-in-transaction sessions
- Transaction ID age in the affected database
- Replication-slot activity and retained WAL
- Archive success and failure history
- Configuration and integrity-related concerns
Based on the validated results, the team can choose the appropriate response, for example, correcting connection-pool behavior, restoring archive operations, investigating an abandoned replication slot, resolving blocked maintenance, or escalating an integrity-related condition.
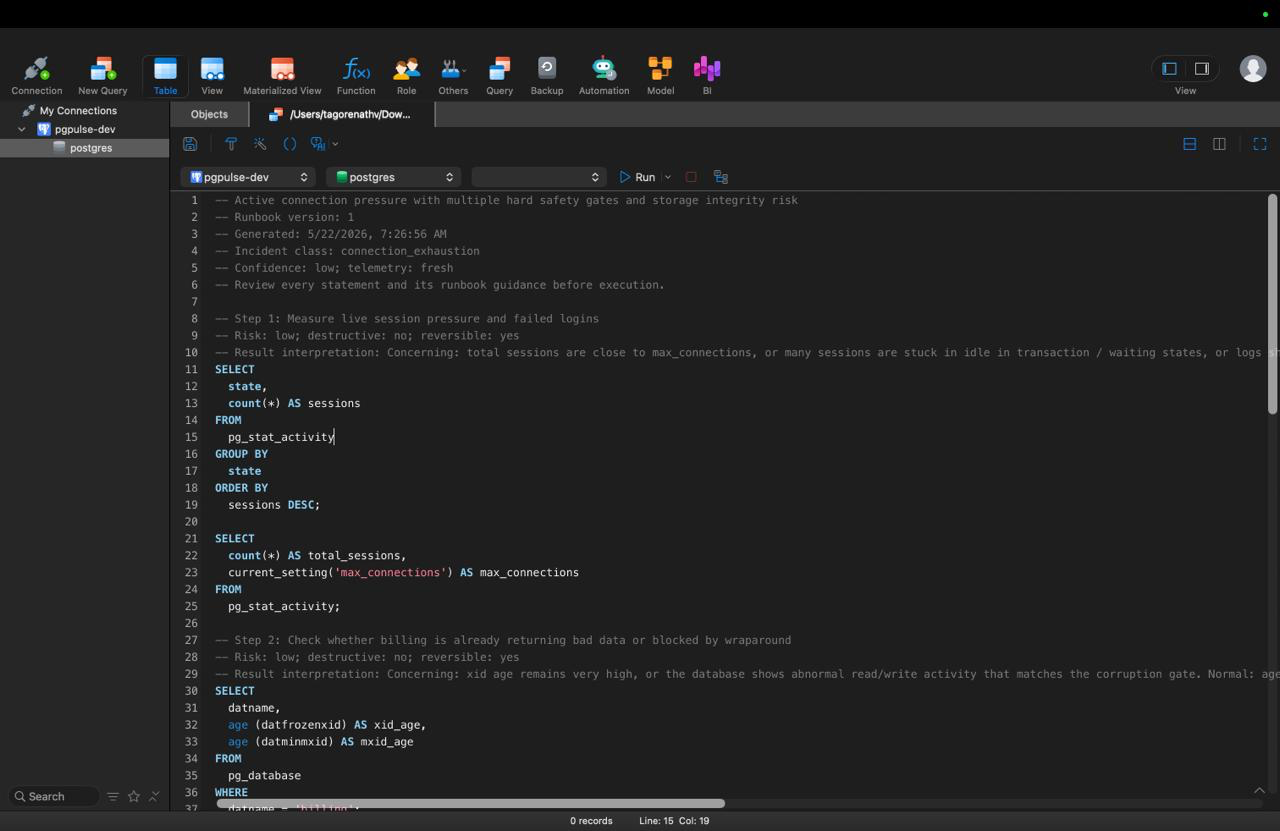
The downloaded SQL bundle remains reviewable inside Navicat before any production step is taken.
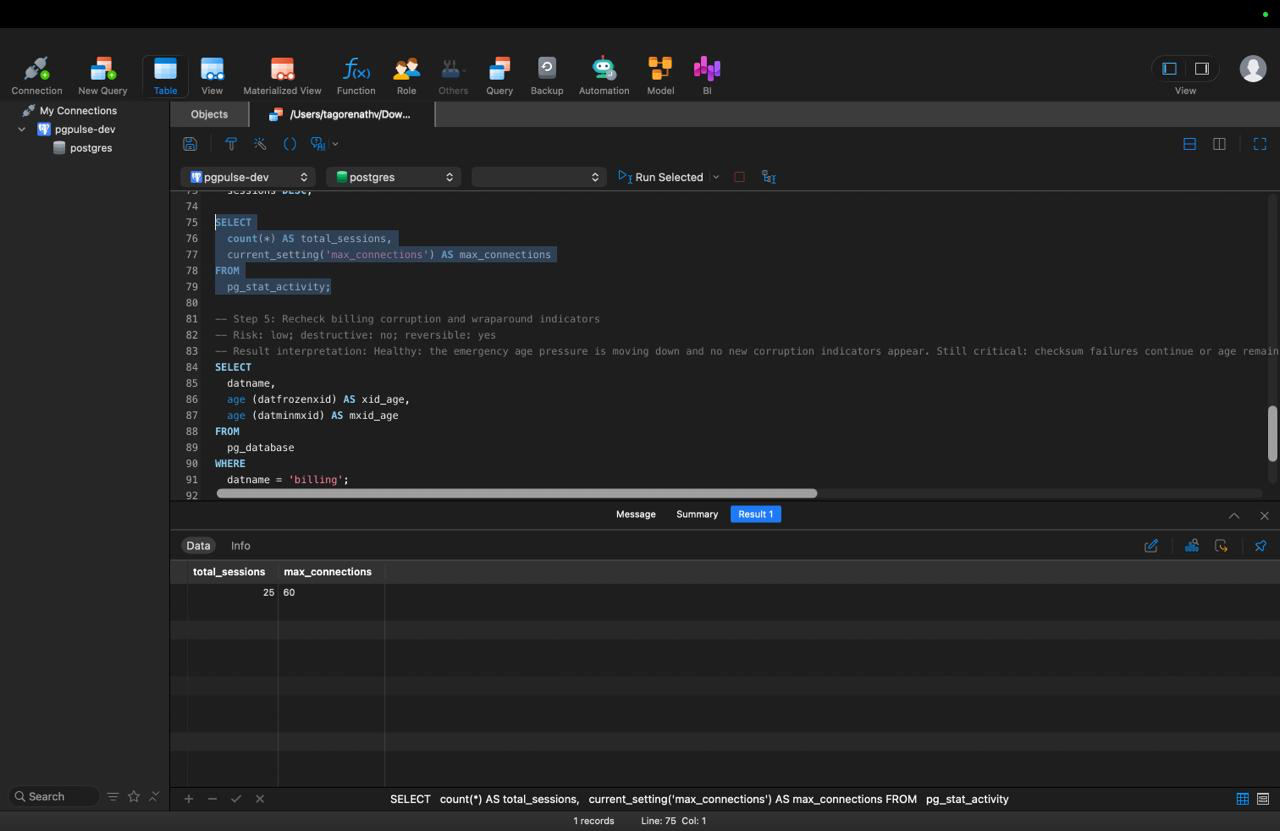
Operators can work through the validation path query by query instead of improvising during the incident.
Navicat provides the controlled environment for executing these investigation and remediation steps, while operator judgment remains central to every production change.
Step 4: Verify Recovery with pgpulse
After the validated remediation steps are completed, the engineer returns to pgpulse to confirm that PostgreSQL has genuinely recovered.
The live health view shows that:
- The Pulse Score has returned to a healthy range.
- No critical gates remain active.
- Incident-related alerts have cleared.
- Connection Pressure has normalized.
- Freeze Risk and Vacuum Engine health have recovered.
- WAL, replication, and recovery indicators have stabilized.
- The improvement remains sustained across fresh telemetry.
This final verification is essential. Executing a SQL command or changing a configuration does not by itself prove that an incident is resolved. pgpulse confirms whether the database has returned to a stable operating state rather than merely showing temporary symptom relief.
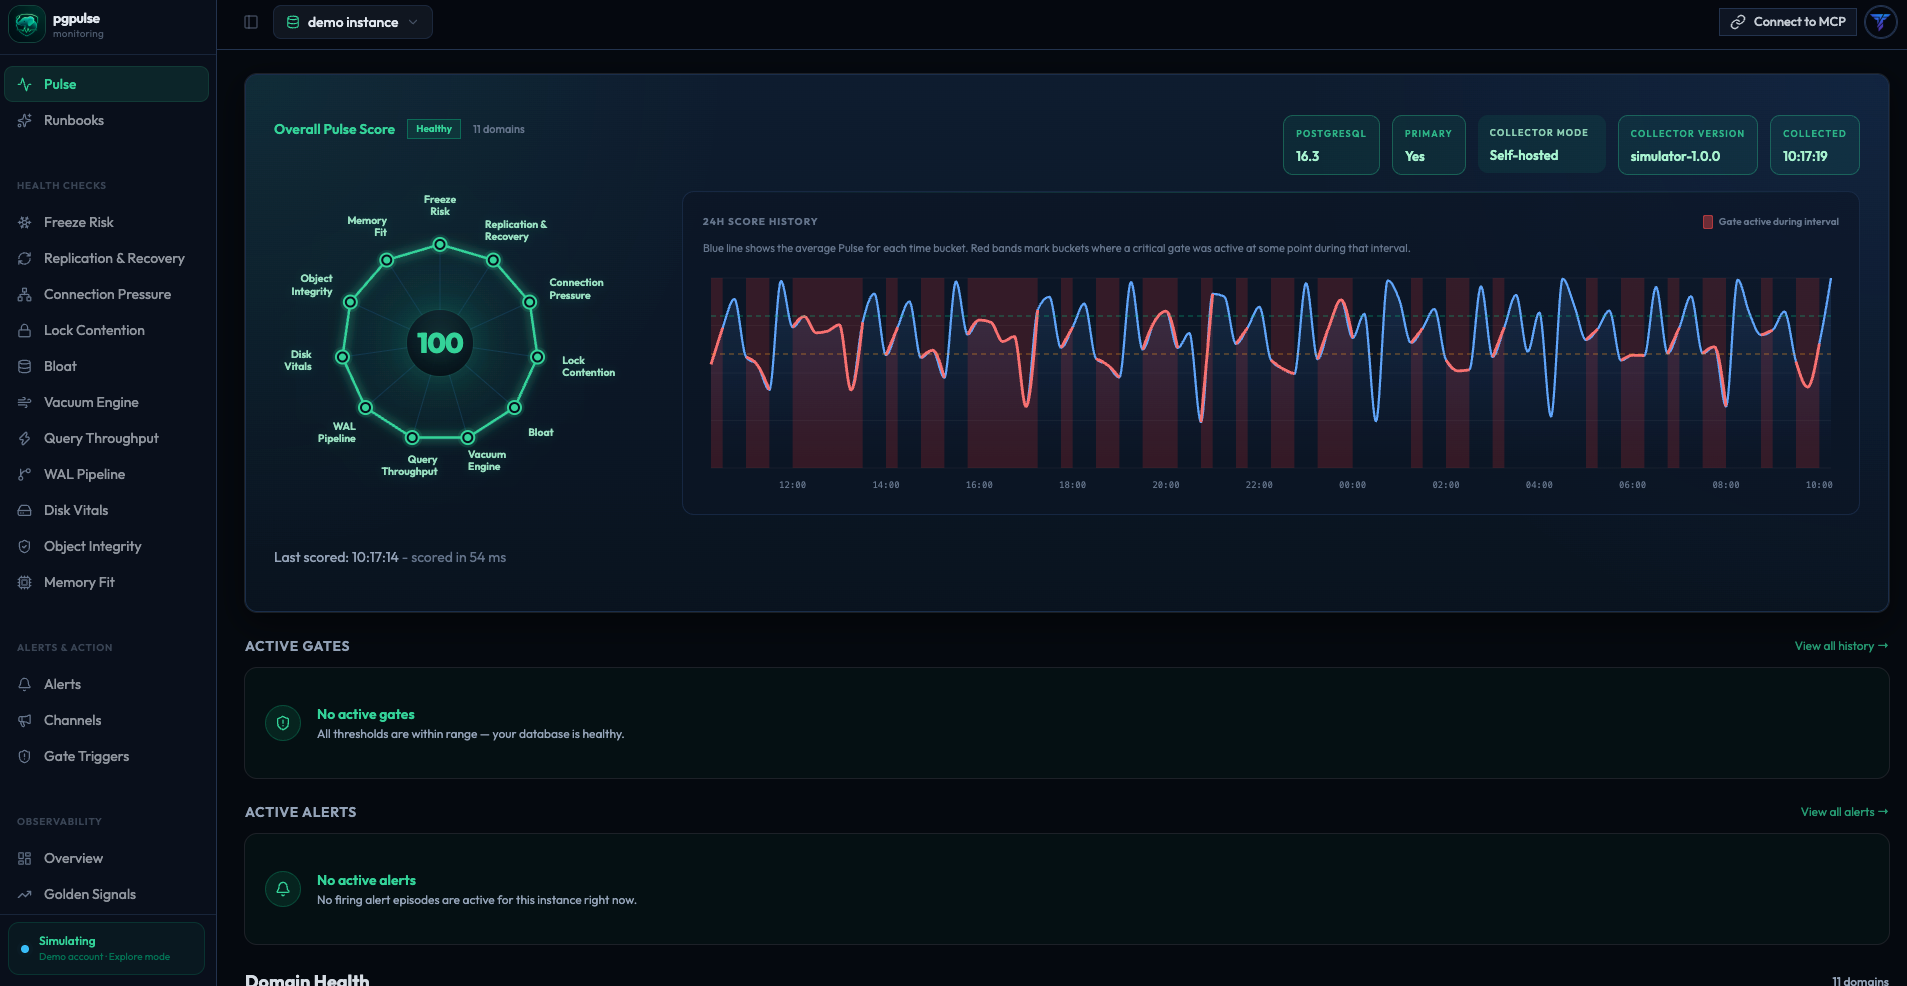
Recovery is confirmed in pgpulse through healthy score, cleared gates, and sustained fresh telemetry.
Conclusion: Closing the PostgreSQL Operations Loop
Modern PostgreSQL teams need more than visibility, and they need more than a place to execute changes. They need a connected operating model that helps them understand what is happening, decide what to do, act safely, and confirm that the system has recovered.
That is where Navicat and pgpulse complement each other.
Navicat gives engineers the hands-on environment required to design schemas, develop queries, manage data, administer access, and apply controlled database changes. pgpulse provides the continuous PostgreSQL intelligence needed to detect degradation, explain engine health, preserve incident context, and verify the effect of every remediation.
Together, they create a practical closed-loop workflow:
Observe with pgpulse. Investigate with evidence. Act with Navicat. Verify with pgpulse.
The result is not simply more tooling. It is a clearer and safer way to operate PostgreSQL, reducing guesswork during incidents, shortening the path from diagnosis to resolution, and giving teams greater confidence as their databases and workloads scale.
Dear Navicat users, would you be interested in a deeper integration between Navicat and pgpulse, connecting PostgreSQL health insights, incident runbooks, validation queries, and recovery verification directly with your database management workflow?
We would love to hear your feedback.
Share this article
Found this useful? Spread the word so more Supabase teams can optimize their observability stack.
Related Insights
Supabase Golden Signals
How to monitor the key indicators for reliability and stability in Supabase: Latency, Traffic, Errors, and Saturation.
Read full article
What Actually Breaks First in Supabase Apps
Supabase is a great platform, but being managed doesn't mean maintenance-free. Here are the 8 Postgres signals that break first when your app starts to scale.
Read full article