Intelligent Postgres observability with Pulse scoring, alerts, advisory, AI-powered runbooks, and hosted MCP access for AI workflows, turning database signals into clear visibility, guided investigation, and confident action.
Works with every Postgres provider
 Supabase
  AWS RDS AWS Aurora
  GCP Cloud SQL
  Azure PostgreSQL
  DigitalOcean
  Neon
Neon  Timescale
  Aiven
Aiven  Crunchy Bridge
  Heroku Postgres
  Render
  Railway
  Fly.io
  CockroachDB
  Self-Hosted Supabase AWS RDS AWS Aurora GCP Cloud SQL Azure PostgreSQL DigitalOcean Neon Timescale Aiven Crunchy Bridge Heroku Postgres Render Railway Fly.io CockroachDB Self-Hosted
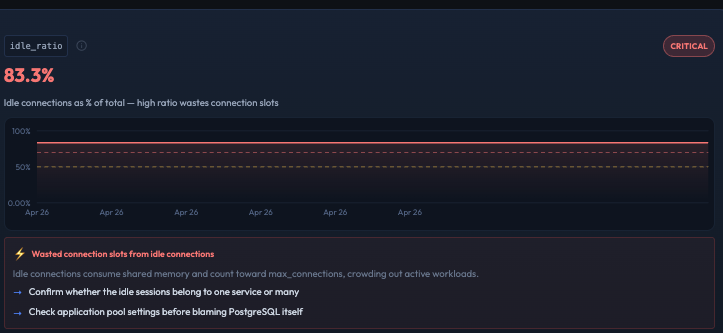
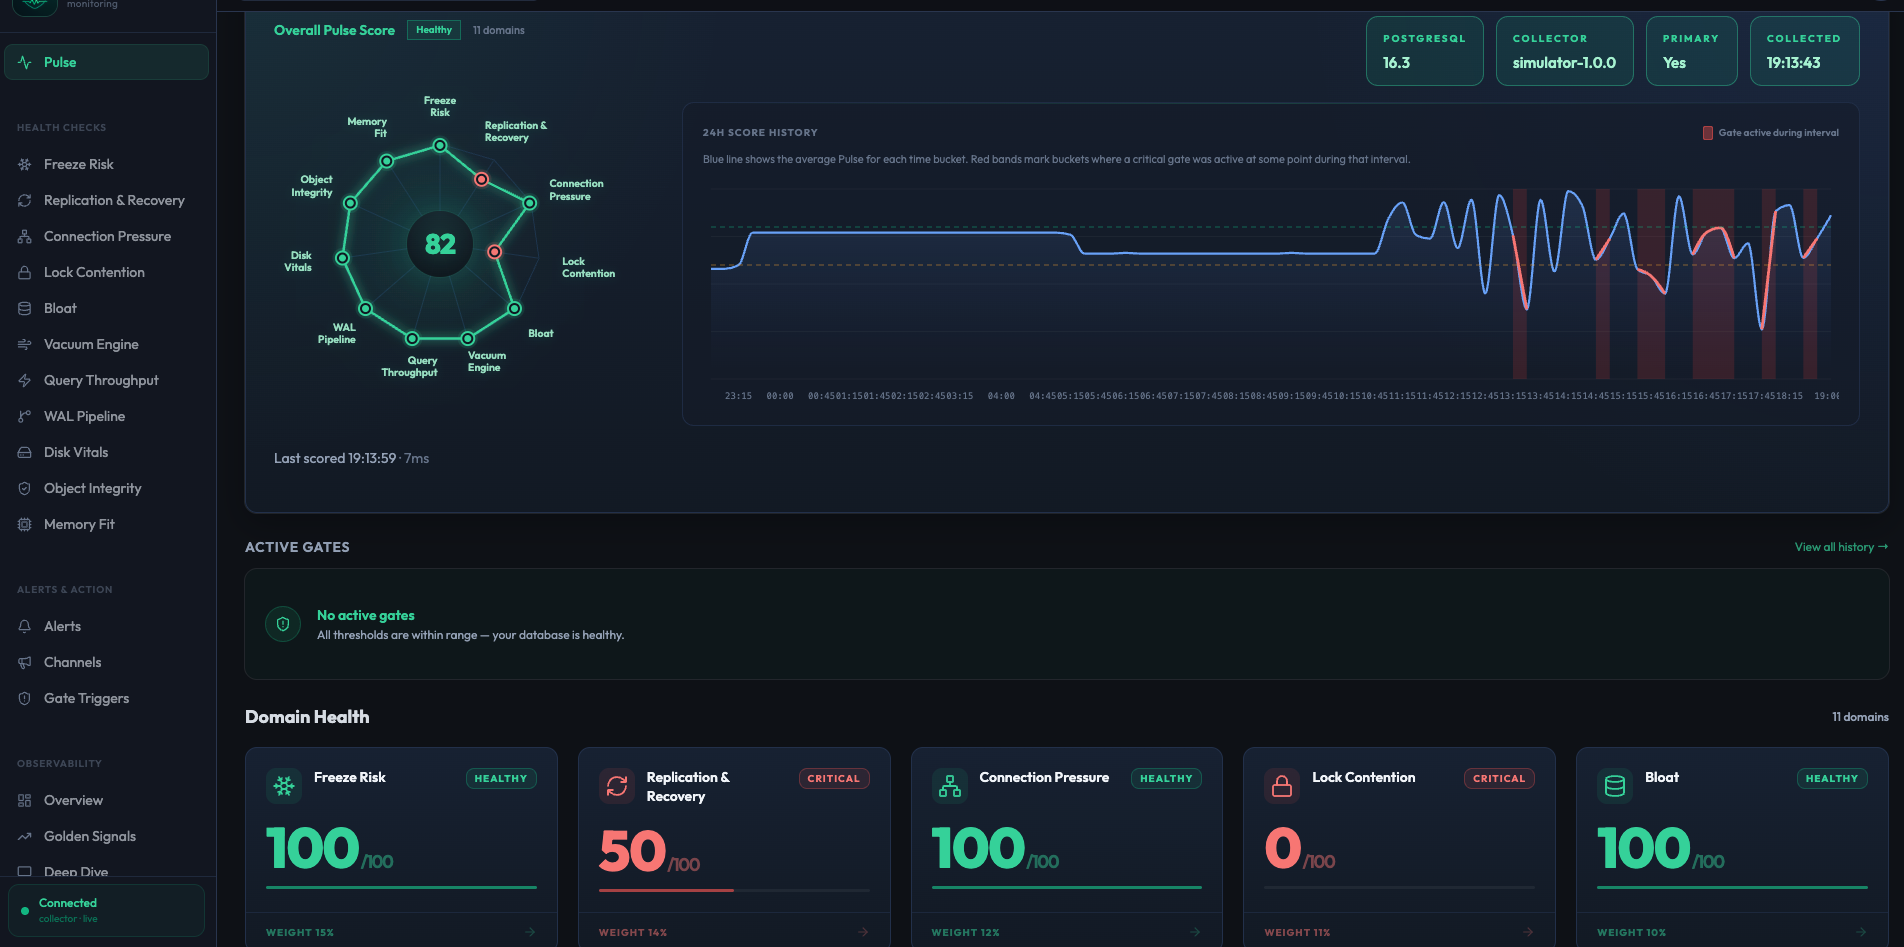
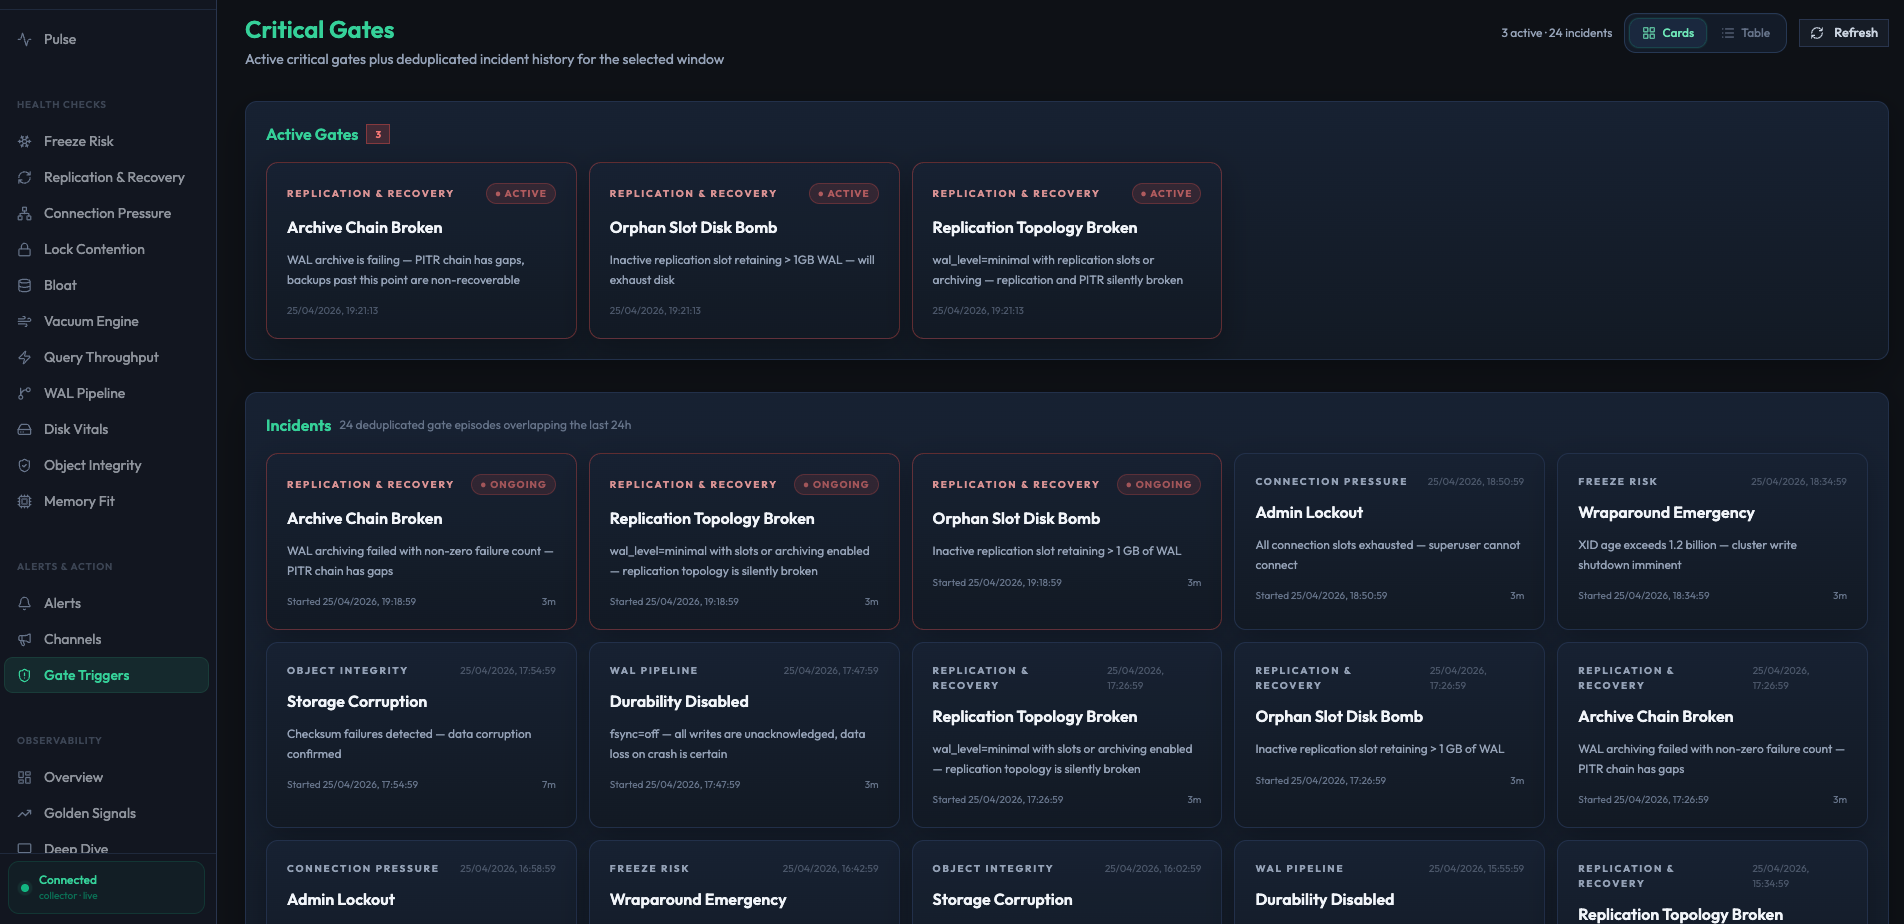
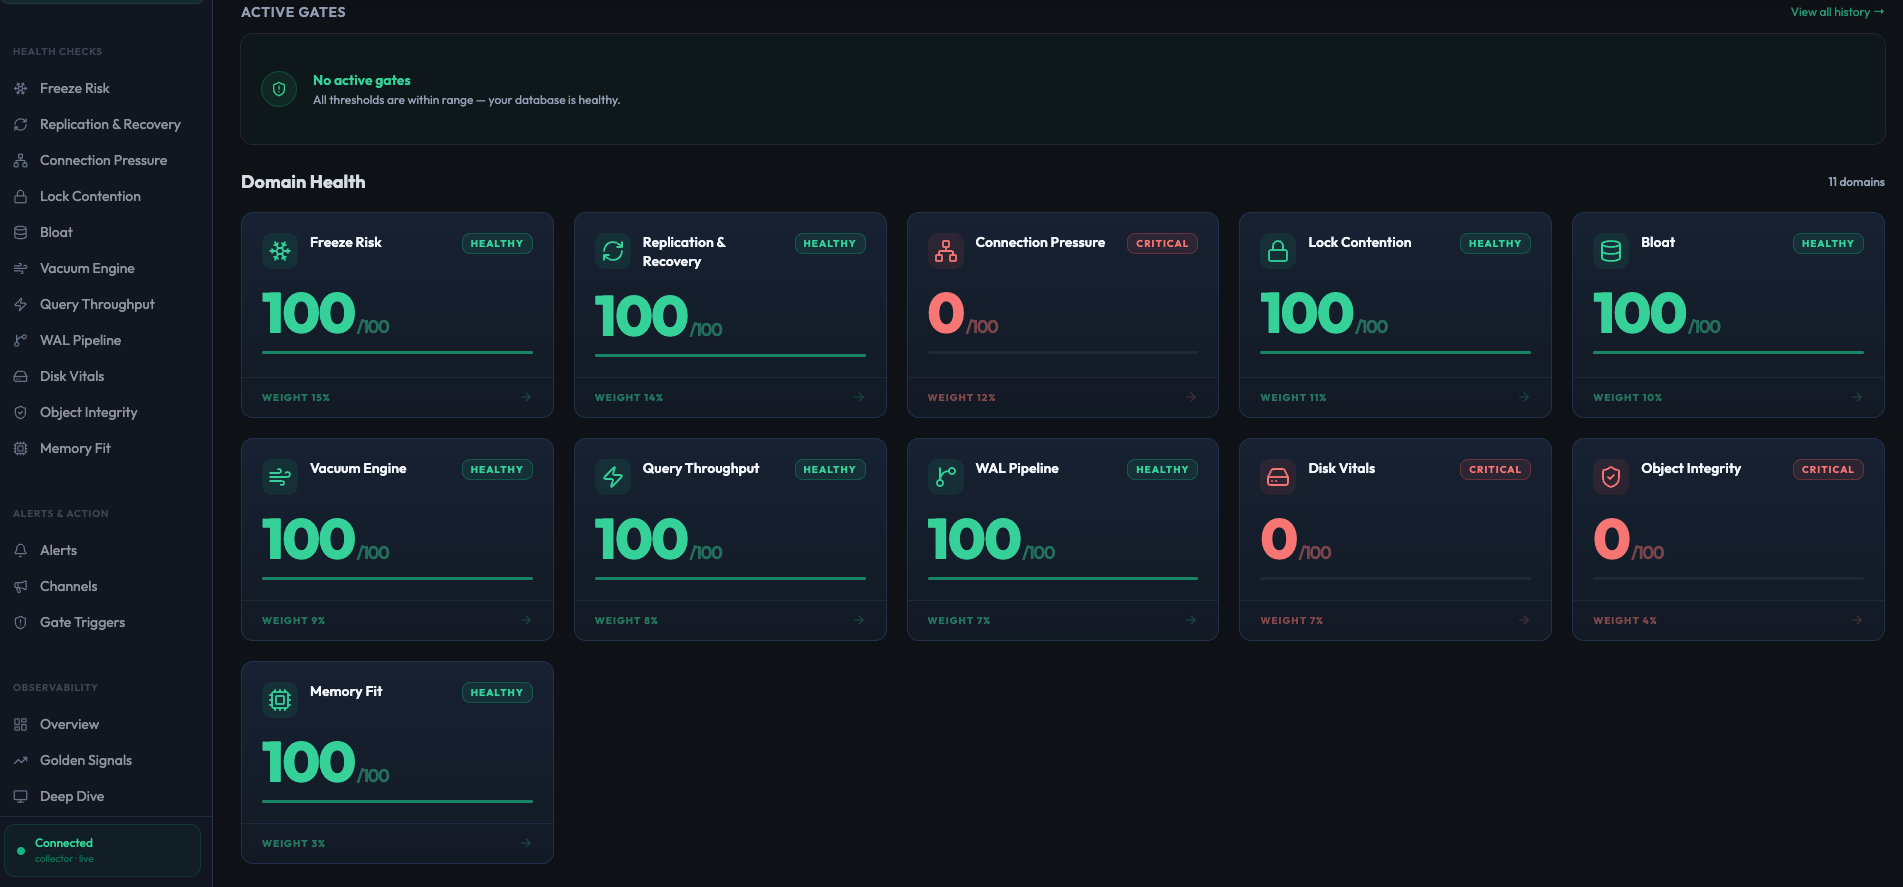
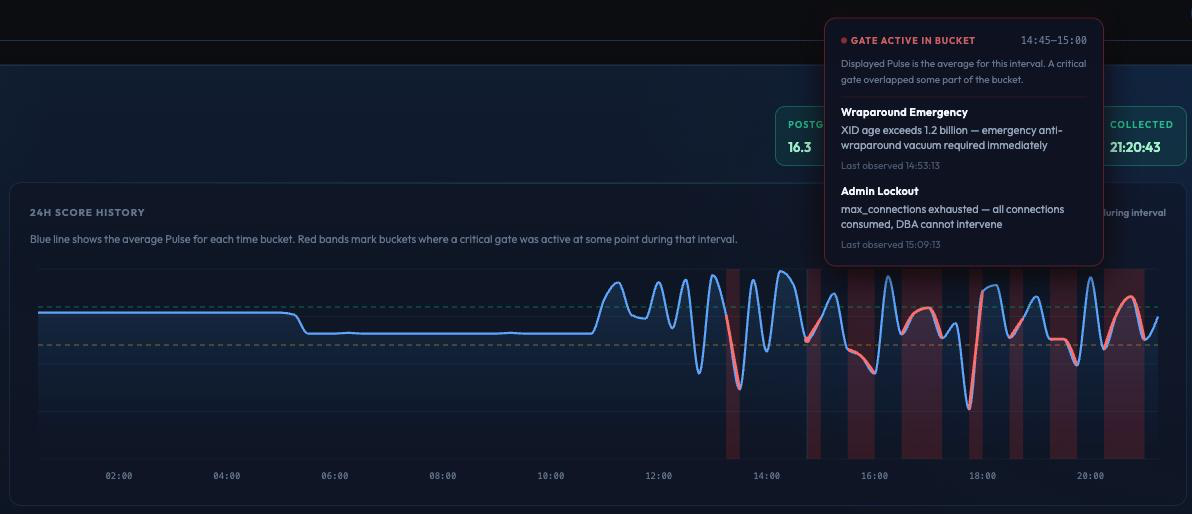
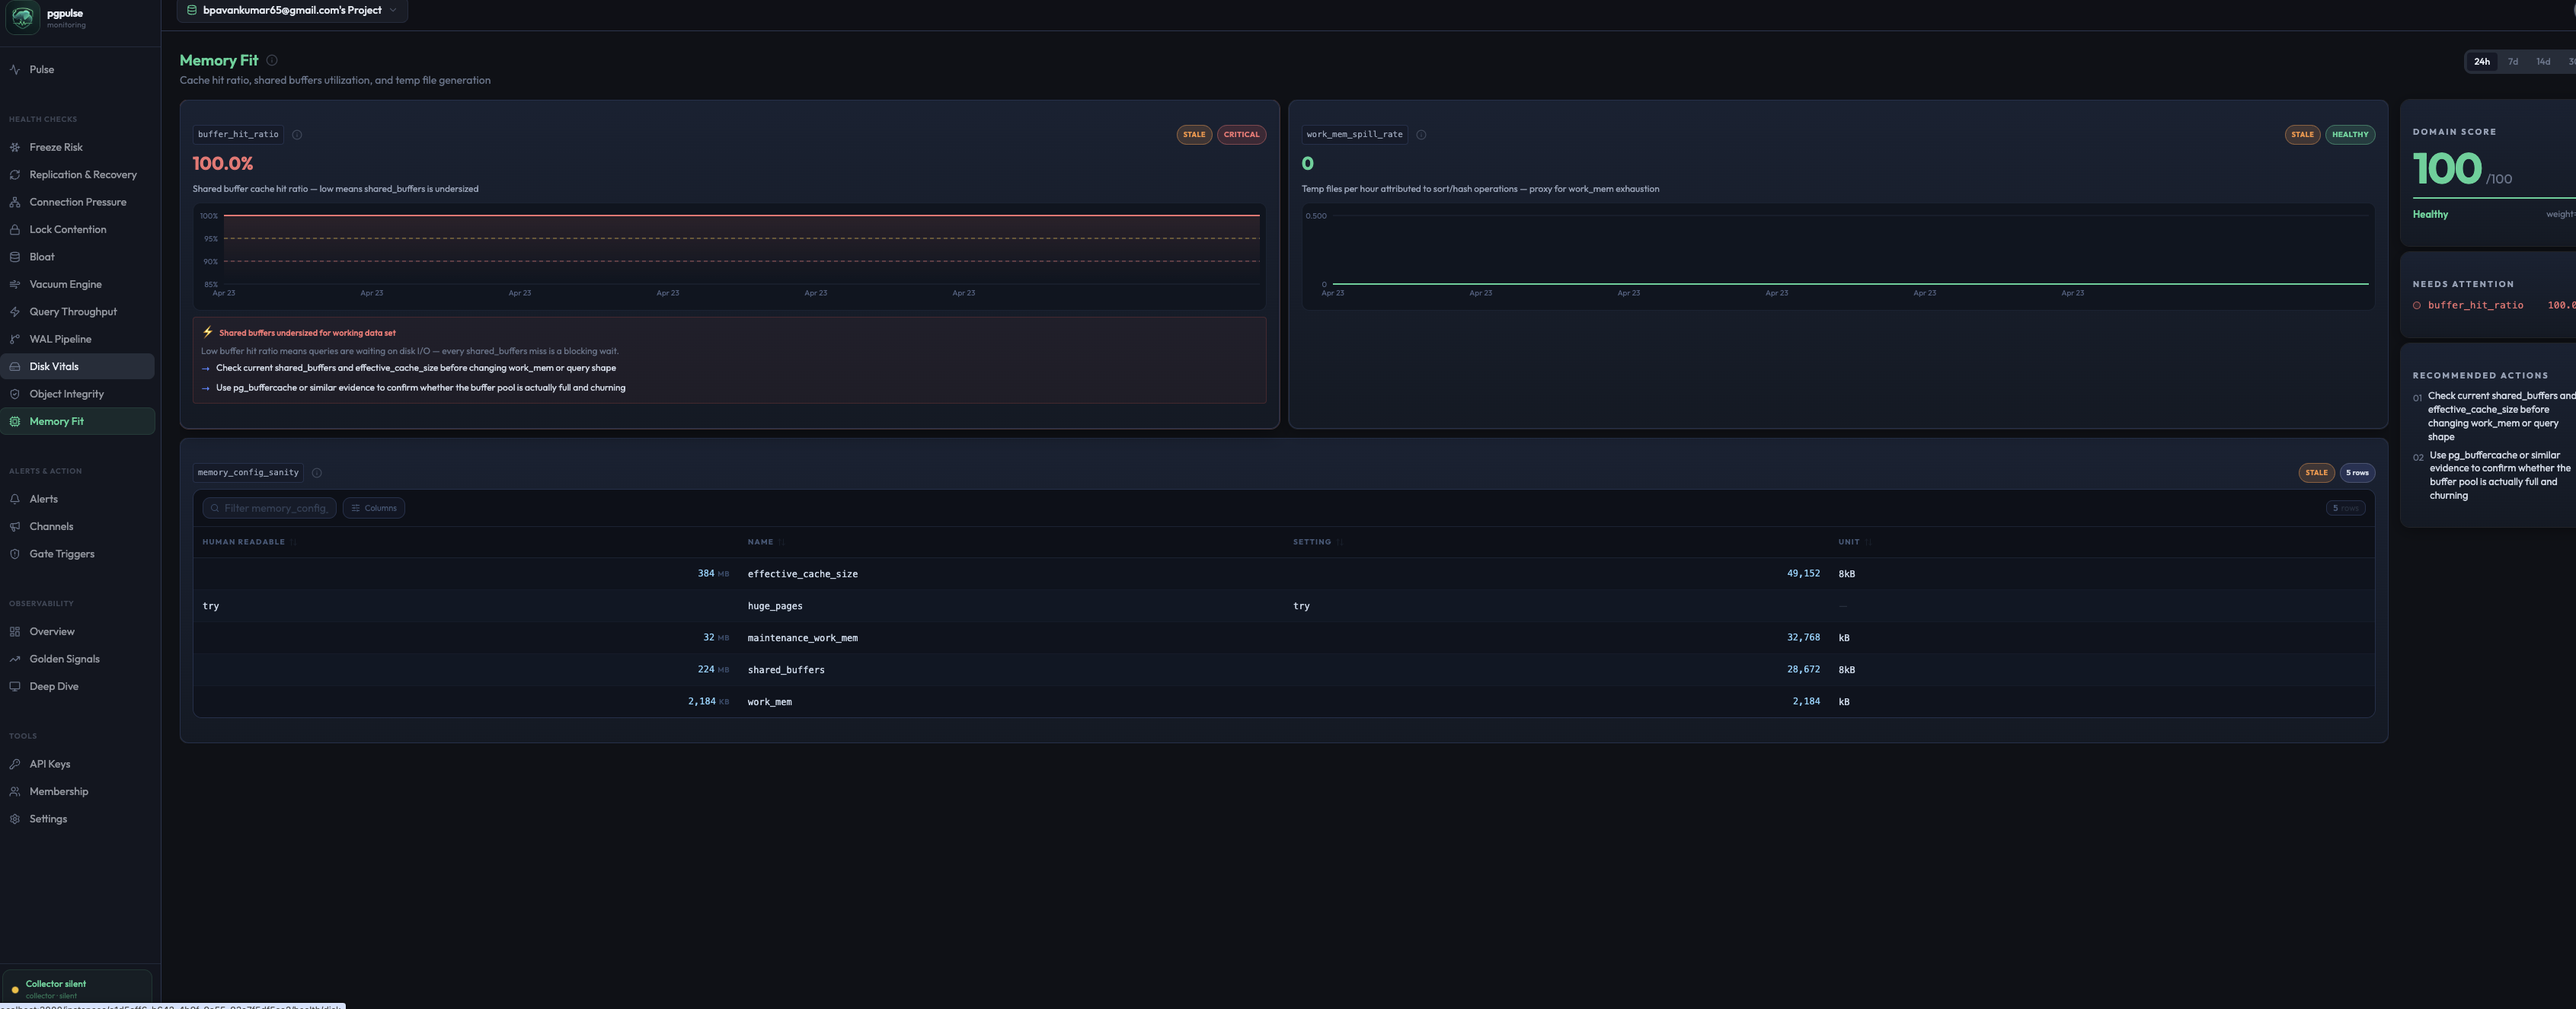
 pgpulse continuously evaluates 11 health domains — from Freeze Risk to WAL Pipeline — and rolls them into a single 0–100 Pulse Score. When a gate fires, you know exactly what broke and how to fix it.
Every domain is scored independently on a 0–100 scale, weighted by criticality, and sorted so the worst-performing areas always surface first.
Product
Dashboards, alerts, and database insights — built for teams, no setup required.
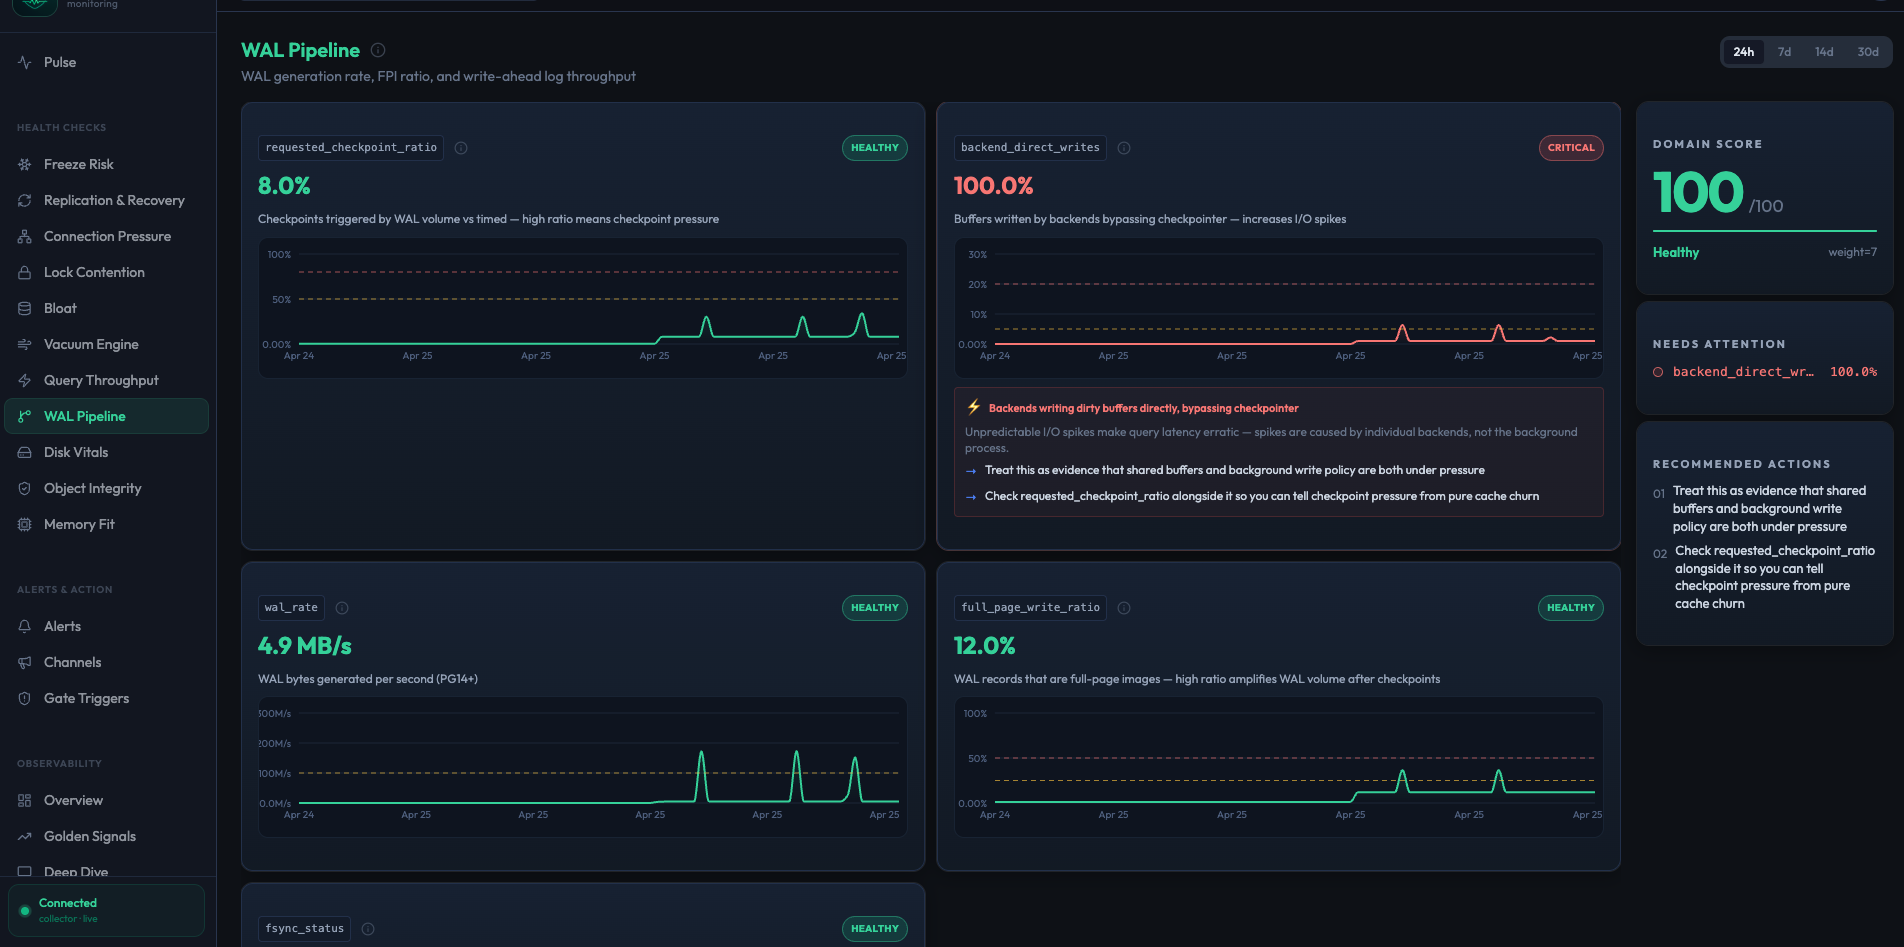
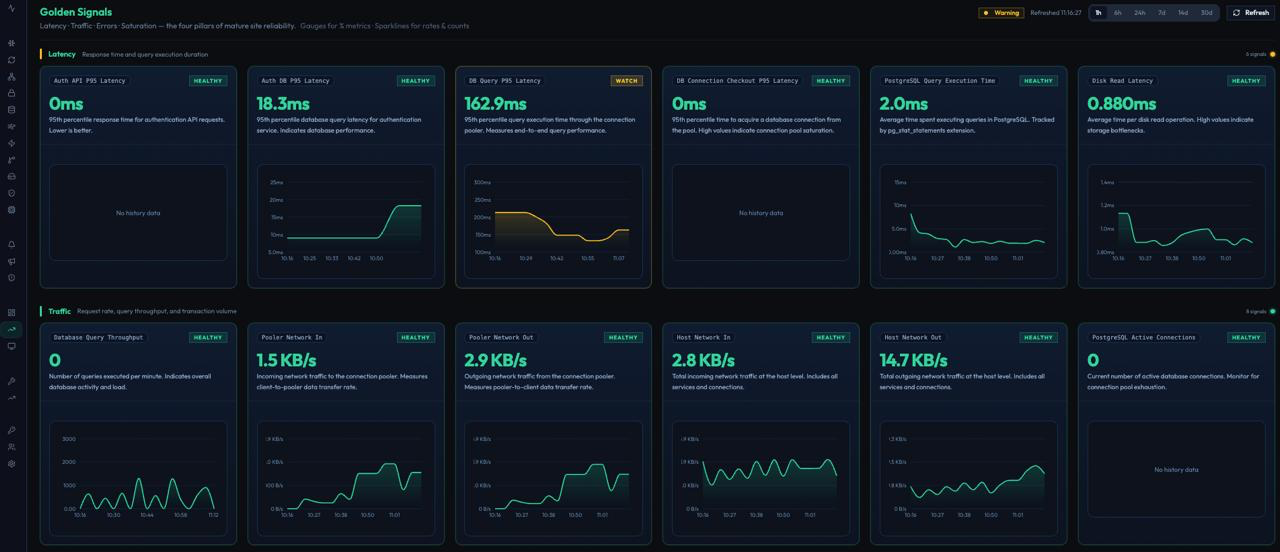
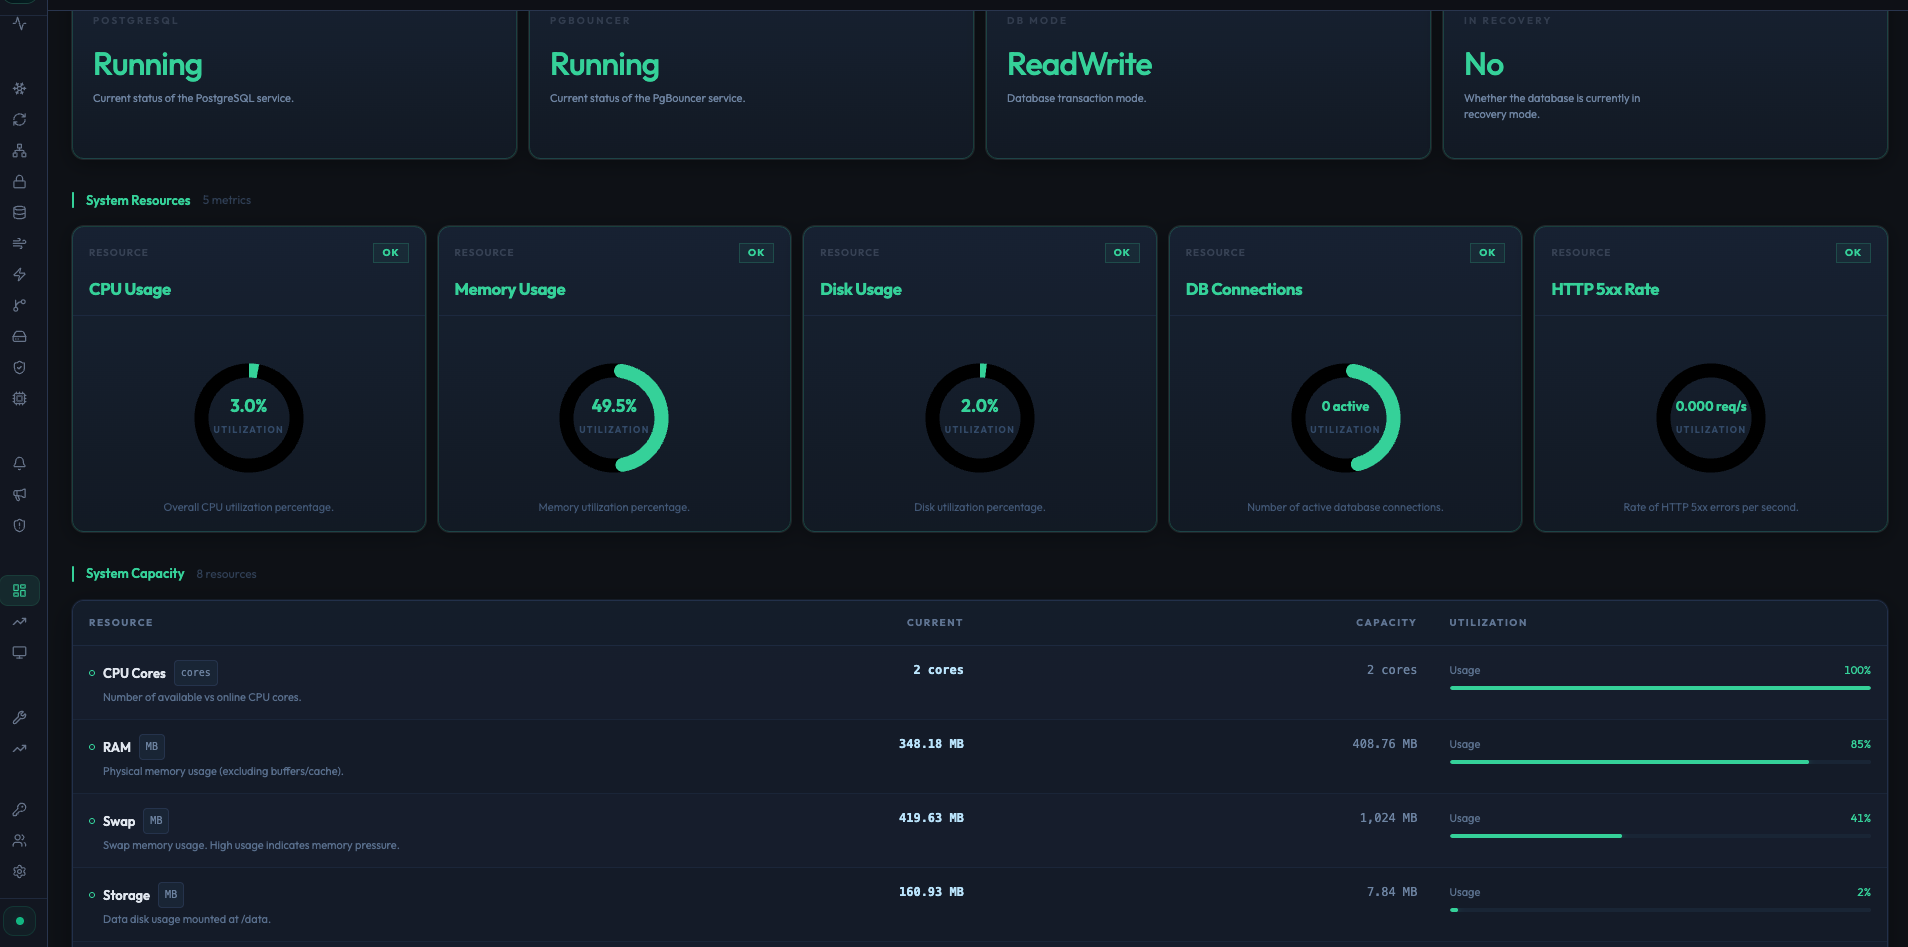
Built directly on native Postgres metrics, pgpulse renders dashboards instantly — connections, latency, error rates, memory, and storage. No agents. No sidecars. No extra stack.
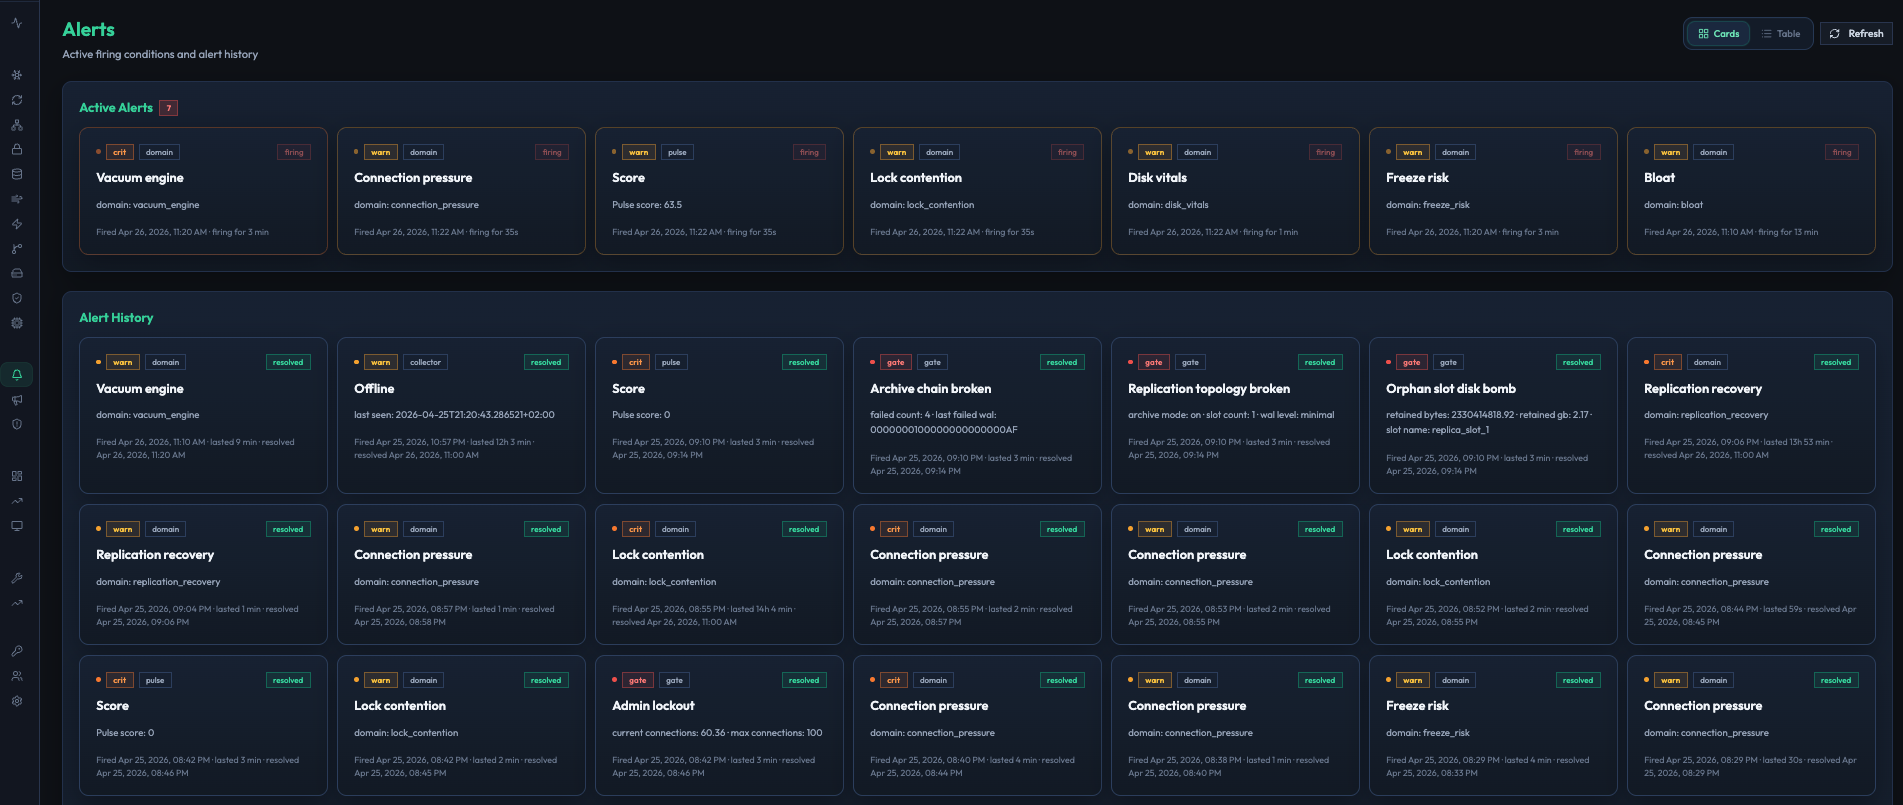
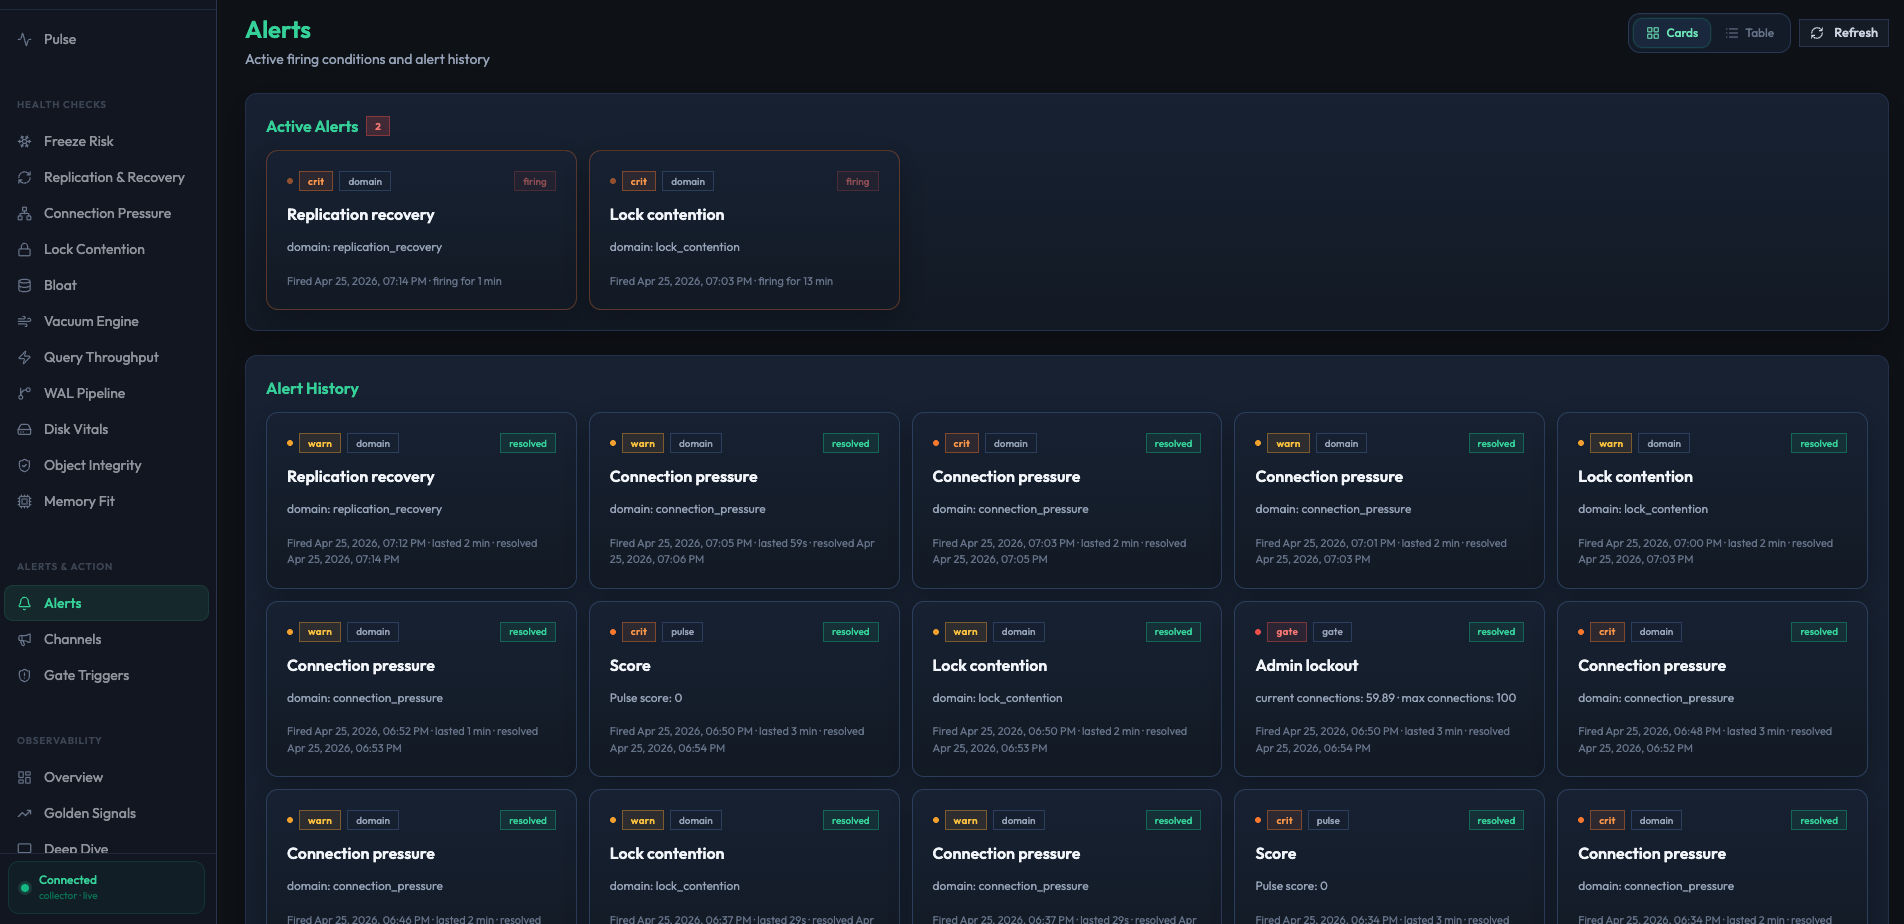
Turn any Postgres metric or advisory finding into a smart alert. Route to Slack, email, or webhook — grouped by project, with noise controls and full alert history.
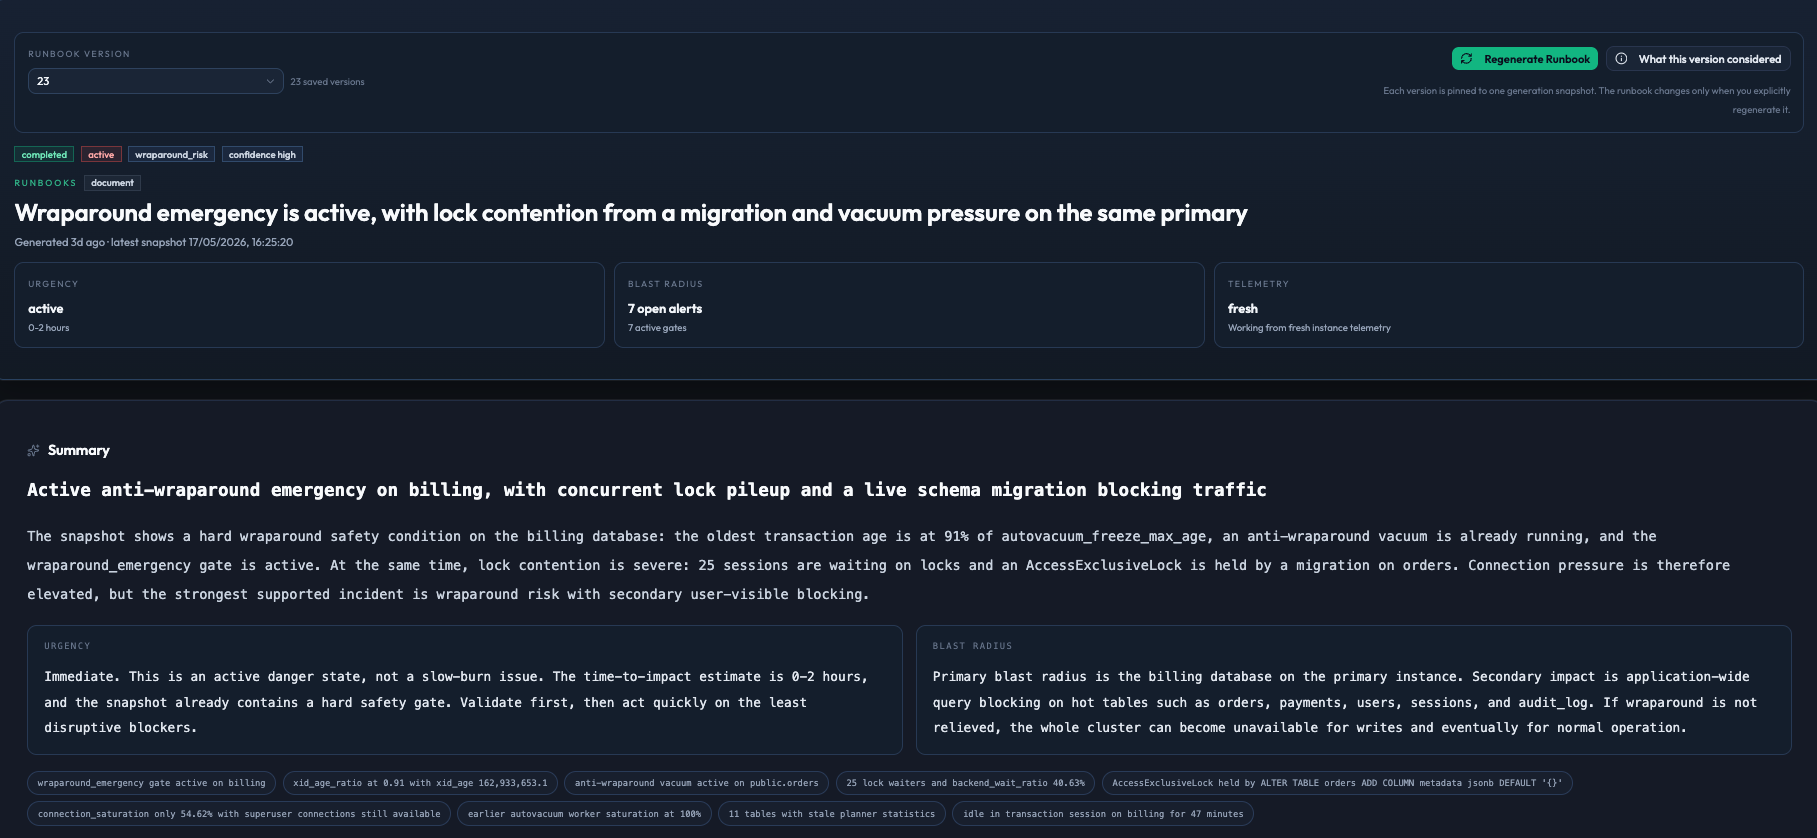
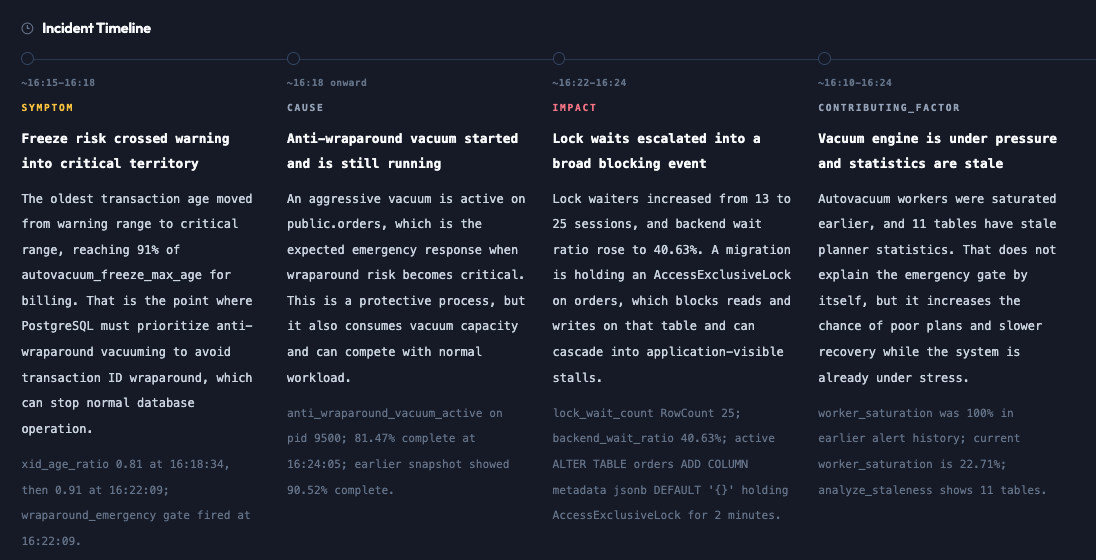
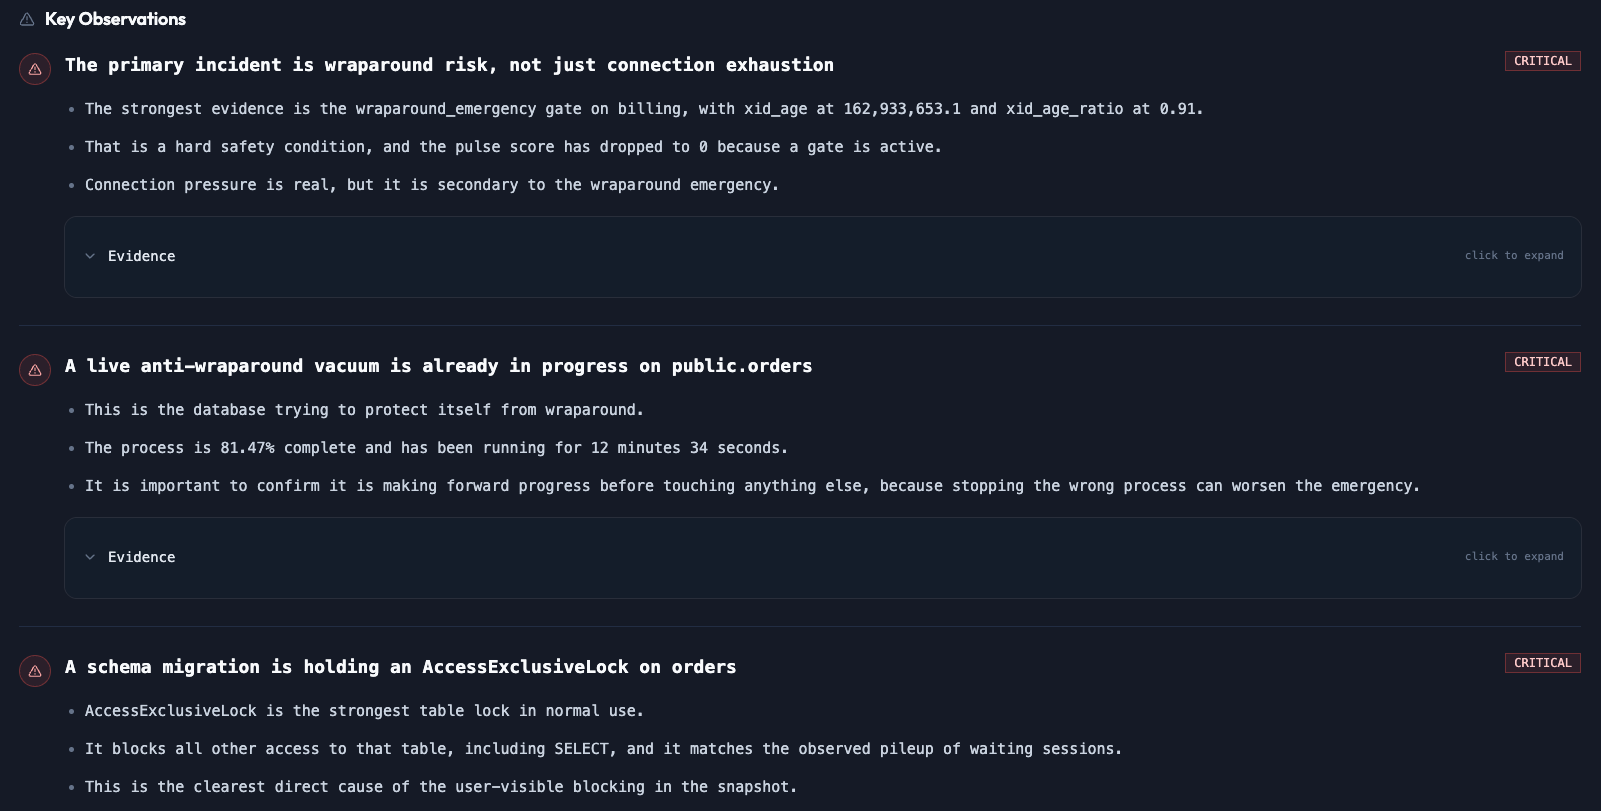
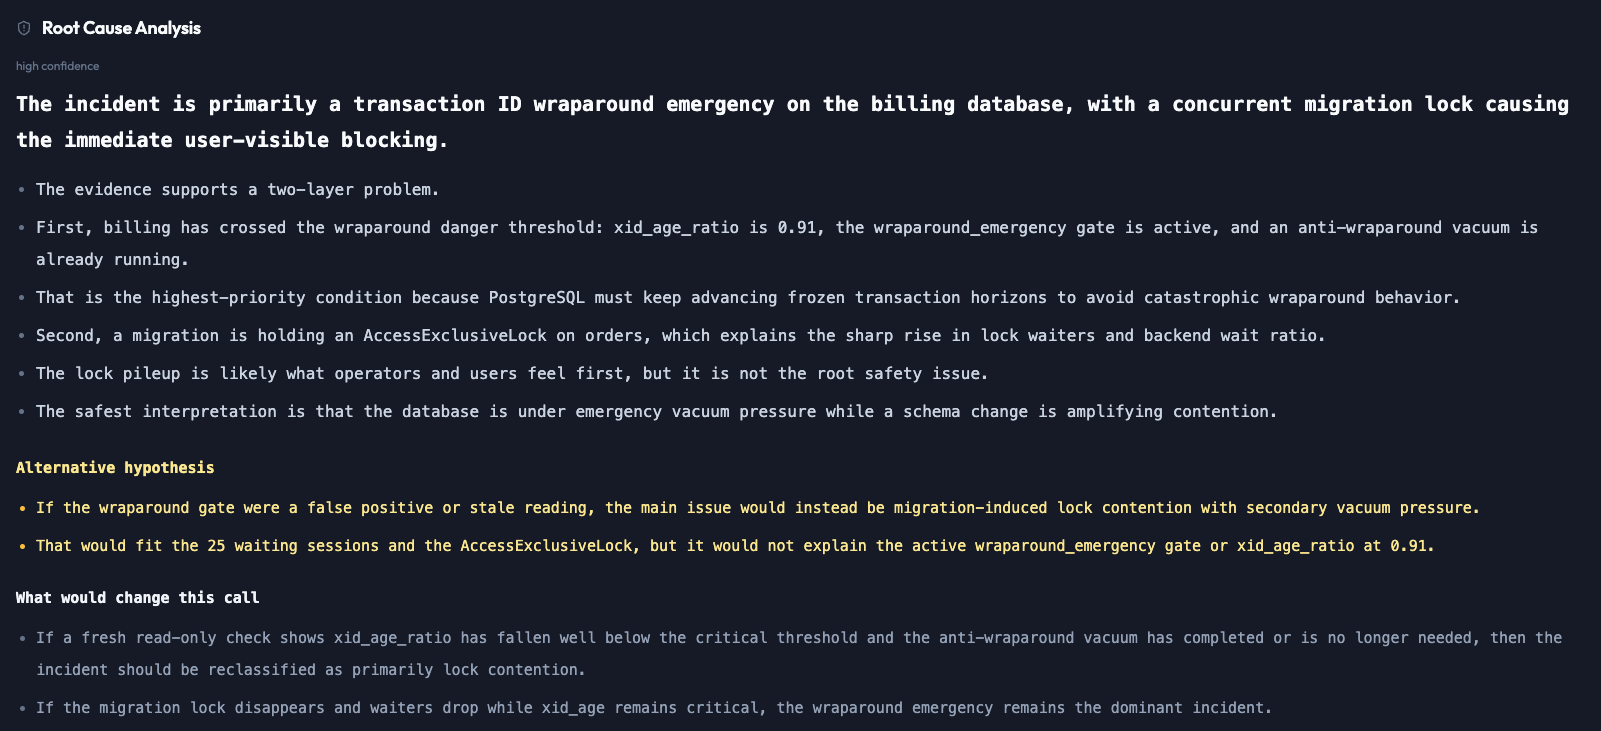
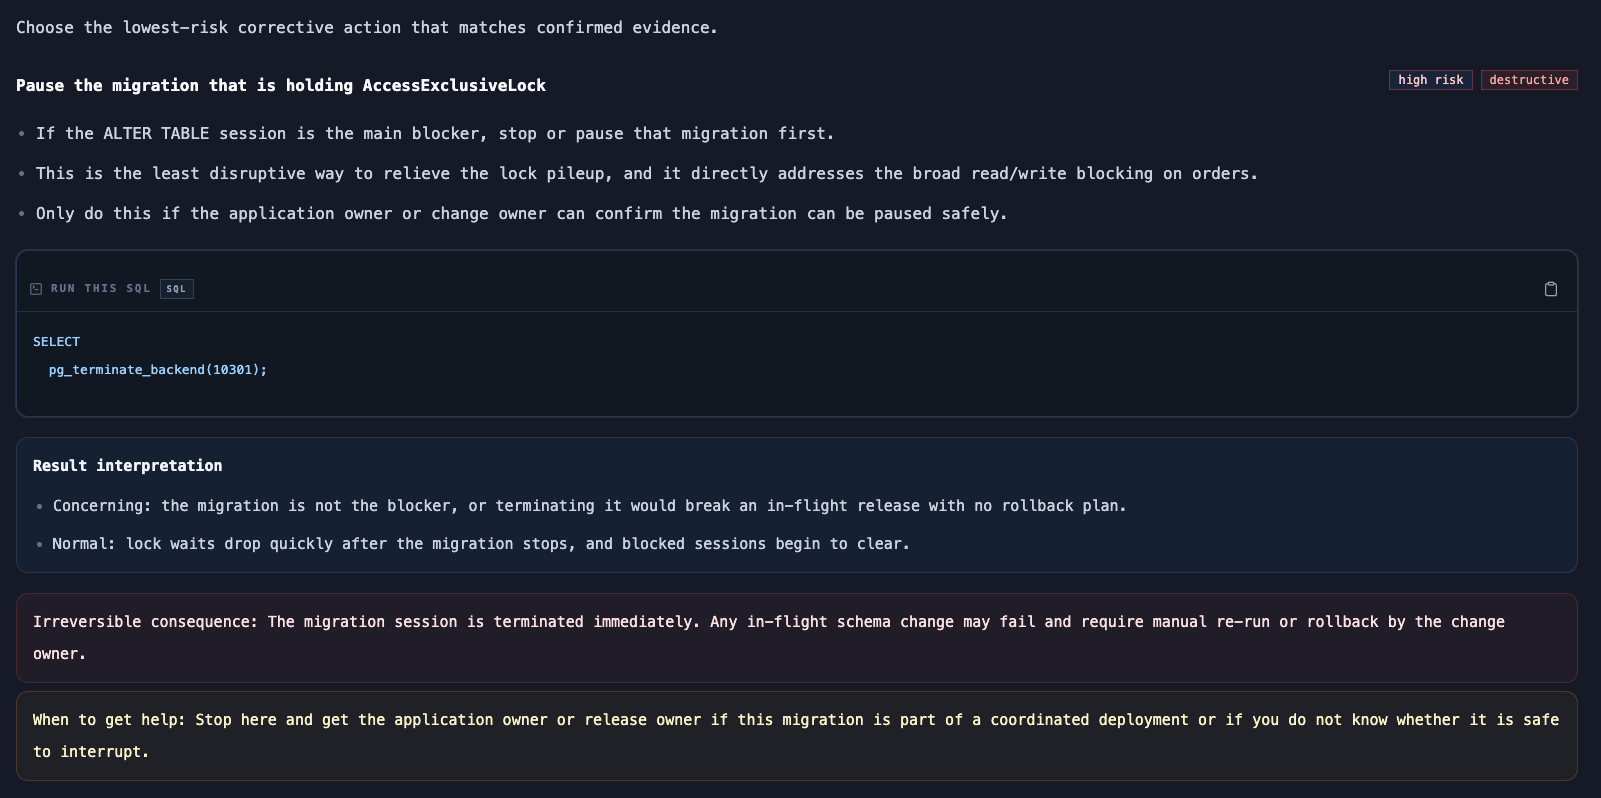
pgpulse turns full-instance state into pinned investigation guides that help operators understand what is happening, why it matters, what to validate first, and which next steps are safest.
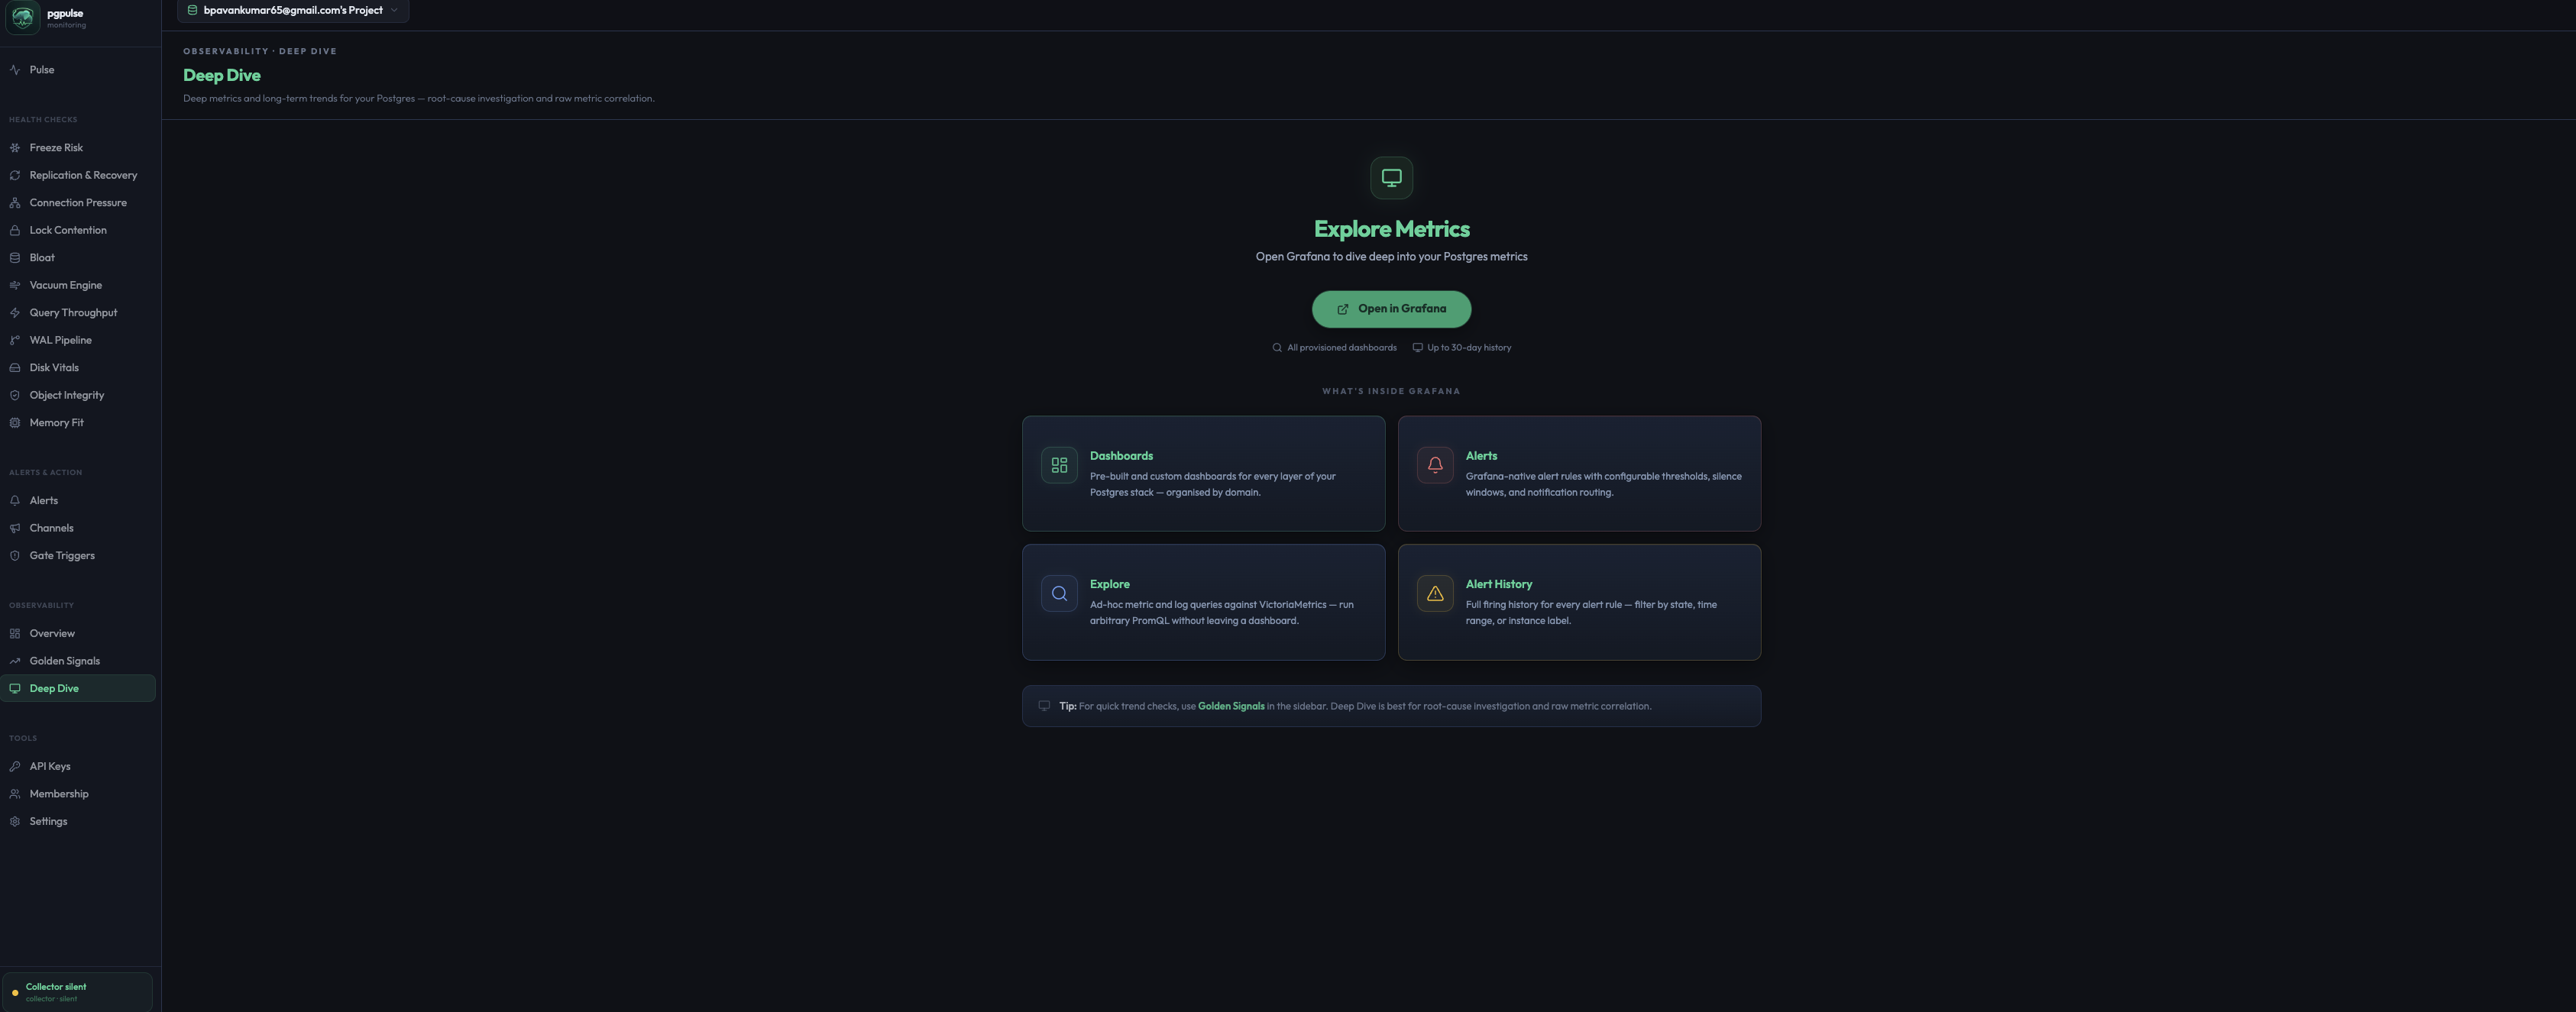
Connect external AI clients to pgpulse through a hosted MCP server so they can investigate health posture, domain evidence, gates, alerts, and recovery context using pgpulse’s investigation model instead of raw database access.
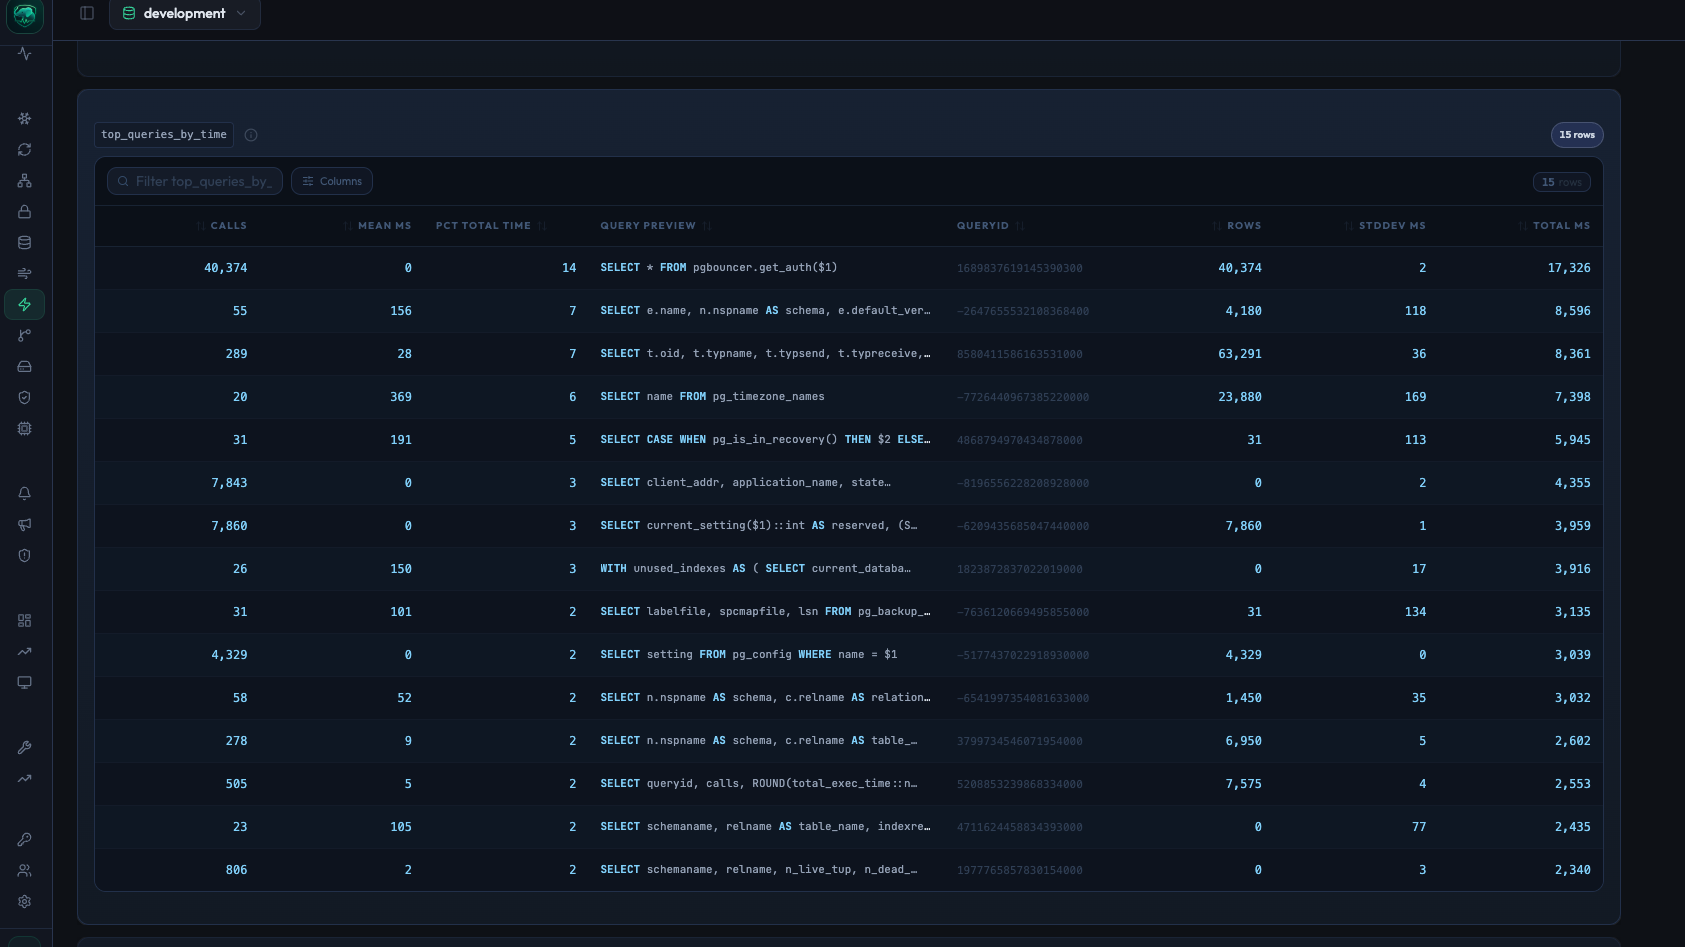
pgpulse runs a continuous advisory engine over your Postgres — surfacing slow queries, index bloat, vacuum lag, and more. Every finding comes with ready-to-run SQL and a clear severity level.
Workspace
Lena
Admin · joined 2d ago
Ryan
Maintainer · alerts
Amir
Viewer · metrics
Shared: #infra-supabase, #db-alerts
Share dashboards with devs, route alerts to ops, keep database advisory visible to platform teams. Simple roles, shared alert channels, and a full audit log.
More from the product
How it Works
Connect your Postgres securely — pgpulse instantly transforms your data into live dashboards, alerts, and insights.
Choose Supabase, AWS, GCP, Azure, or any supported Postgres provider.
Link your project securely with OAuth or a connection string.
Dashboards and alerts light up with native metrics in under a minute.
Pricing
Start free, scale as you grow. Full access from day one.
14-day free trial · No card required
Essential Postgres monitoring for every Supabase project.
Real-time signals, alerts, and deeper insights for growing teams.
Need custom retention or more team members? Talk to us about Enterprise.