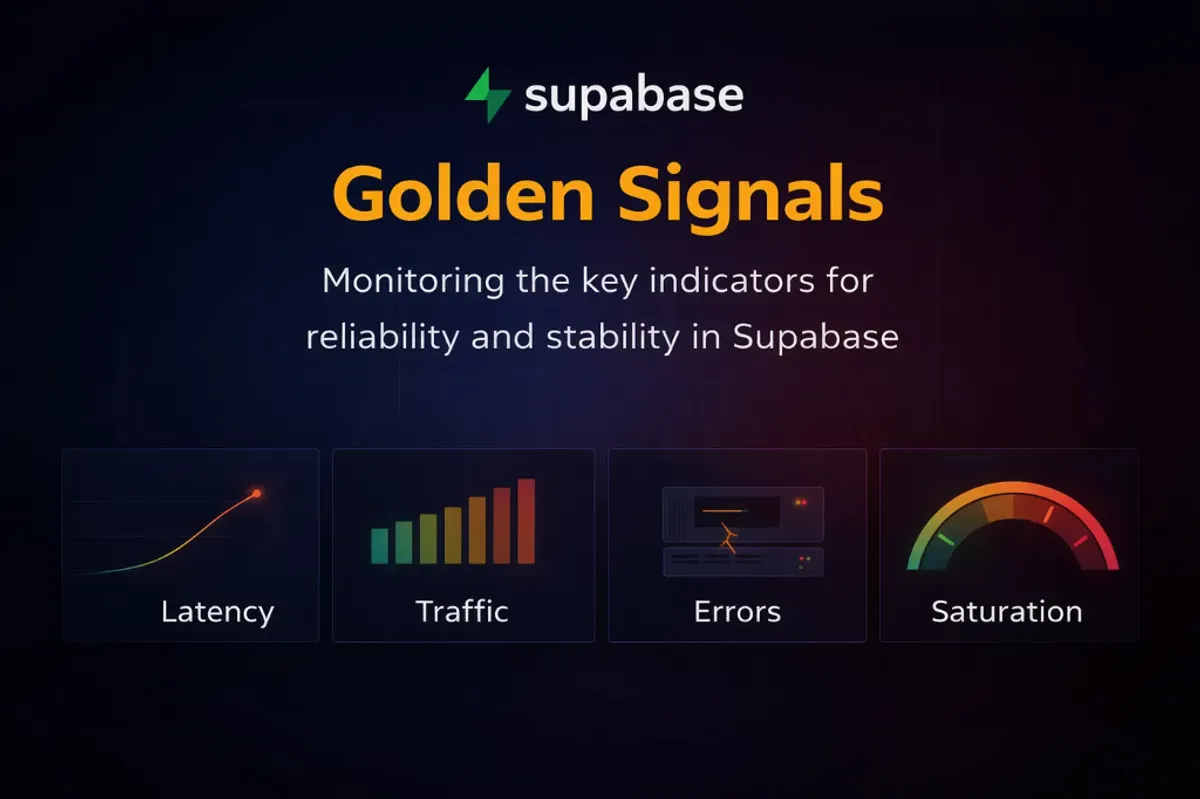
Supabase Golden Signals
How to monitor the key indicators for reliability and stability in Supabase: Latency, Traffic, Errors, and Saturation.
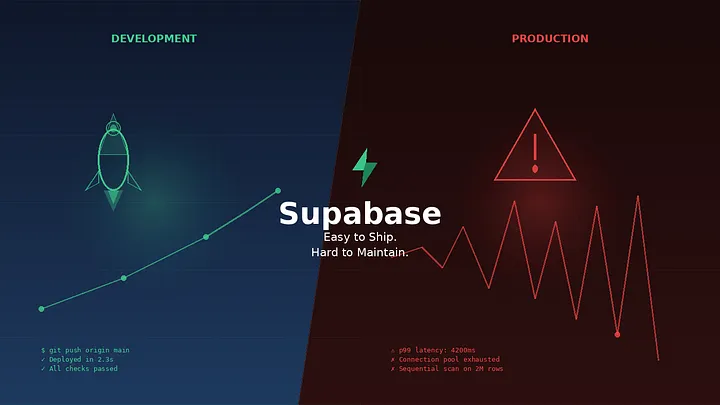
Supabase is a great platform. It bundles everything you need to build and ship: Postgres, Authentication, Data APIs, Edge Functions, Realtime, Storage, and Vectors. You can go from idea to production in a weekend.
But once you’re live, the game changes. Our focus shifts from speed to operational stability.
We’ve learned this the hard way. We don’t need more dashboards. We don’t need to chase every metric Supabase exposes. We need the right signals that tell us something real is wrong before our users feel it.
The concept comes from Google’s SRE practice. They called them Golden Signals. Four signals that, when watched together, give you a complete picture of system health without drowning in noise. We’ve applied this framework specifically to Supabase, because Supabase isn’t just a database. It’s Postgres, a connection pooler, an auth service, and the host they all run on. Each layer can fail independently, and each one shows up differently across the four signals.
In this post, we break down what each signal means in the context of Supabase, what to measure, and how we think about alerting on each one.
Latency
This signal answers the question: Are users feeling slowness?
Slow is often worse than down. A 500 error is visible. But if a page takes a few seconds to load, it feels broken, and so users often leave without saying why.
In a Supabase app, latency has layers worth watching separately:
- DB Query P95 Latency: This represents 95% of queries completing within this time, giving us the ground truth of our Postgres performance. When this number climbs, the database itself is working harder than it should.
- DB Query P99 Latency: This represents the slowest 1% of queries, showing us the tail end of our performance distribution. When the gap between P95 and P99 is large, something occasional is hurting badly. Usually a missing index or a query waiting behind a lock.
- DB Connection Checkout P95 Latency: This represents how long our app spends waiting just to get a connection, before any query runs. When this number rises, the pool is under pressure, and users are already feeling the slowness before Postgres even sees the request.
- Long Running Queries: This represents queries that have been running beyond 5 seconds, each one holding locks that block everything queued behind it. We watch this as a live table rather than a graph because we need the exact query text and runtime, not just a count.
- Disk Read / Write Await: This represents how long the disk takes to complete a read or write operation. When await climbs past 10ms sustained, every query touching storage pays that cost on top of execution time.
- Replication Lag: This represents how far behind our replica is from the primary, measured in bytes of WAL not yet applied. When this grows, reads from the replica return stale data silently. No error, no warning, just old data reaching our users.
Latency tells us the experience. But it doesn’t tell us why. A query slowing down looks different when we know traffic just tripled. That’s what the next signal is for.
Traffic
This signal answers the question: Is the system handling more load than usual?
A spike in query latency means very different things depending on what traffic is doing. If transactions per second doubled in the same window, we have a load problem. If traffic is flat and latency is still climbing, we have a query problem. Without traffic data alongside latency, we’re guessing at the cause.
In Supabase, traffic isn’t just request count. It’s the shape of the load hitting the data plane. These are the panels we watch:
- Transactions Per Second: This represents the rate of committed and rolled back transactions hitting our database. When this number spikes, everything downstream feels it like query time, pool pressure, and disk IO. It’s the single best indicator of overall DB load.
- Rows Returned Per Second: This represents how many rows Postgres is sending back across all queries. A sudden spike here without a corresponding rise in transactions usually means a missing LIMIT clause, a bad query plan, or a data export running in the background.
- Rows Written Per Second: This represents inserts, updates, and deletes combined. High write volume drives WAL generation, which drives replication lag and autovacuum pressure. When this climbs unexpectedly, something is writing more than it should.
- Active Client Connections: This represents the number of clients currently connected through Supavisor. This is the traffic signal closest to saturation. When this approaches the pool ceiling, the next spike in requests doesn’t slow down; it fails.
- Pooler Queries Per Second: This represents the rate of query cycles being handled by Supavisor. Watching this alongside active connections tells us whether we have many clients doing little work or a few clients doing a lot of it.
- DB Network Throughput: This represents bytes moving in and out of the database host. Large result sets, bulk inserts, and replication all show up here. A spike in throughput with no corresponding rise in TPS usually means large payloads, not high request volume.
- Disk IO Utilisation %: This represents the percentage of time the disk is busy. High write traffic, checkpoint flushes, and autovacuum all compete for disk time. When this stays elevated, every operation touching storage queues behind it.
Traffic tells us the volume. But volume alone doesn’t tell us what broke. That’s what the next signal is for.
Errors
This signal answers the question: Is anything actually failing right now?
Errors in Supabase need to be read by layer. A deadlock in Postgres and a connection error in Supavisor both look like failures to our users, but they have completely different causes and completely different fixes. Aggregating them into a single error rate loses the information we need to act fast.
These are the panels we watch:
- Deadlocks Per Second: This represents transactions that couldn’t complete because two operations were waiting on each other. Any occurrence here is a code-level bug, usually two transactions acquiring locks in different orders. Deadlocks don’t slow things down; they fail silently and leave our users with errors.
- Transaction Rollbacks Per Second: This represents transactions that failed and were rolled back. A baseline of rollbacks is normal. A spike means errors are reaching the database layer, not just the application. When this climbs, something upstream is consistently failing.
- DB Conflicts Per Second: This represents queries on our replica that were cancelled because they conflicted with replication. When this rises, replica reads are becoming unreliable. Users reading from the replica are getting cancelled queries, not just stale data.
- DB Lock Waits: This represents queries currently waiting to acquire a lock held by another transaction. Lock waits don’t always become deadlocks, but they stack up. A growing queue here means long-running transactions are holding the door closed for everyone else.
- Pooler Client Errors Per Second: This represents connections that Supavisor couldn’t serve: requests that came in and had nowhere to go. These map directly to user-facing failures. When this fires, users are getting errors right now.
- Exporter Scrape Errors: This represents failures in the metrics collection process itself. This is the panel that tells us when we can’t trust the other panels. A scrape error means our visibility just went dark, which is its own kind of alert.
Errors tell us what broke. But the most dangerous problems in production aren’t the ones that break; rather, they’re the ones that quietly fill up until there’s no room left. That’s what the next signal is for.
Saturation
This signal answers the question: How close are we to a hard limit?
Saturation is the signal most teams underinvest in until it’s too late. The reason is that saturation doesn’t degrade gracefully in Supabase. When the connection pool exhausts, the next request doesn’t slow down — it fails immediately. When the disk fills up, Postgres doesn’t warn us — it stops accepting writes. These aren’t gradual curves. They’re cliffs.
These are the panels we watch:
- DB Connection Pool Utilisation %: This represents how much of our connection pool is currently in use. This is the most critical saturation metric in any Supabase app. At 100%, every new request fails without ever reaching the database.
- Pooler Waiting Clients: This represents clients currently queued waiting for a connection to free up. Any sustained count here means users are already waiting. This is the saturation signal that shows up in latency first; checkout time climbs before the pool fully exhausts.
- Pooler Active Server Connections: This represents the connections Supavisor currently holds open to Postgres. Watching this alongside waiting clients tells us whether we need more pool capacity or whether Postgres itself is the bottleneck.
- Total DB Backends vs max_connections: This represents the total number of backend processes in Postgres against the configured maximum. We track this separately from pool utilisation because direct connections bypass Supavisor entirely. Both ceilings matter.
- DB Cache Hit Rate %: This represents the proportion of data reads served from memory rather than disk. Below 99% means Postgres is going to disk more than it should. The working set has grown beyond shared_buffers, and query latency will follow.
- Dead Tuples / Table Bloat: This represents rows marked for deletion that autovacuum hasn’t cleaned up yet. Bloat degrades index performance quietly over time. By the time it shows up in query latency, it’s already been accumulating for a while.
- Transaction ID Age (XID Wraparound): This represents how far we are through Postgres’s transaction ID limit. This one has no graceful handling; Postgres will shut down to protect data integrity when it gets close enough to the limit. We watch it so it never becomes a surprise.
- Host CPU Load: This represents the compute load on the underlying host. Sustained high CPU means queries are compute-bound. Latency will climb, and no amount of query tuning fixes a host that’s simply out of headroom.
- Memory Pressure %: This represents how much of the available memory is in use. When this approaches 90%, Postgres starts evicting pages from shared_buffers. Cache hit rate drops, disk reads increase, and query latency climbs as a result.
- Disk Free Space: This represents how much storage is left on the host filesystem. When this reaches zero, Postgres stops accepting writes entirely. No degradation, no warning, just a hard stop.
Saturation is where most production incidents actually start. Not with an error, not with a spike in latency, but with a resource that’s been quietly filling up for days until there’s nothing left.
The four signals together
Each signal catches a different failure mode:
- Latency catches the degradation that users are already feeling
- Traffic catches capacity pressure before it becomes a crisis
- Errors catch failures that are already happening
- Saturation catches limits we’re approaching before anything breaks
None of them is redundant. A system can have healthy latency and be saturating. It can have zero errors and a p95 that’s been quietly climbing for weeks. We need all four, watched consistently, with thresholds; not just when something feels wrong.
The goal isn’t to watch more metrics. It’s to watch the right ones before something forces us to look.
This is the foundation we built pgpulse, unifying observability for Supabase that goes beyond dashboards into alerts and database advisory, one click to connect.
Shipping gets us live. Golden signals keep us stable.
Share this article
Found this useful? Spread the word so more Supabase teams can optimize their observability stack.
Related Insights
What Actually Breaks First in Supabase Apps
Supabase is a great platform, but being managed doesn't mean maintenance-free. Here are the 8 Postgres signals that break first when your app starts to scale.
Read full article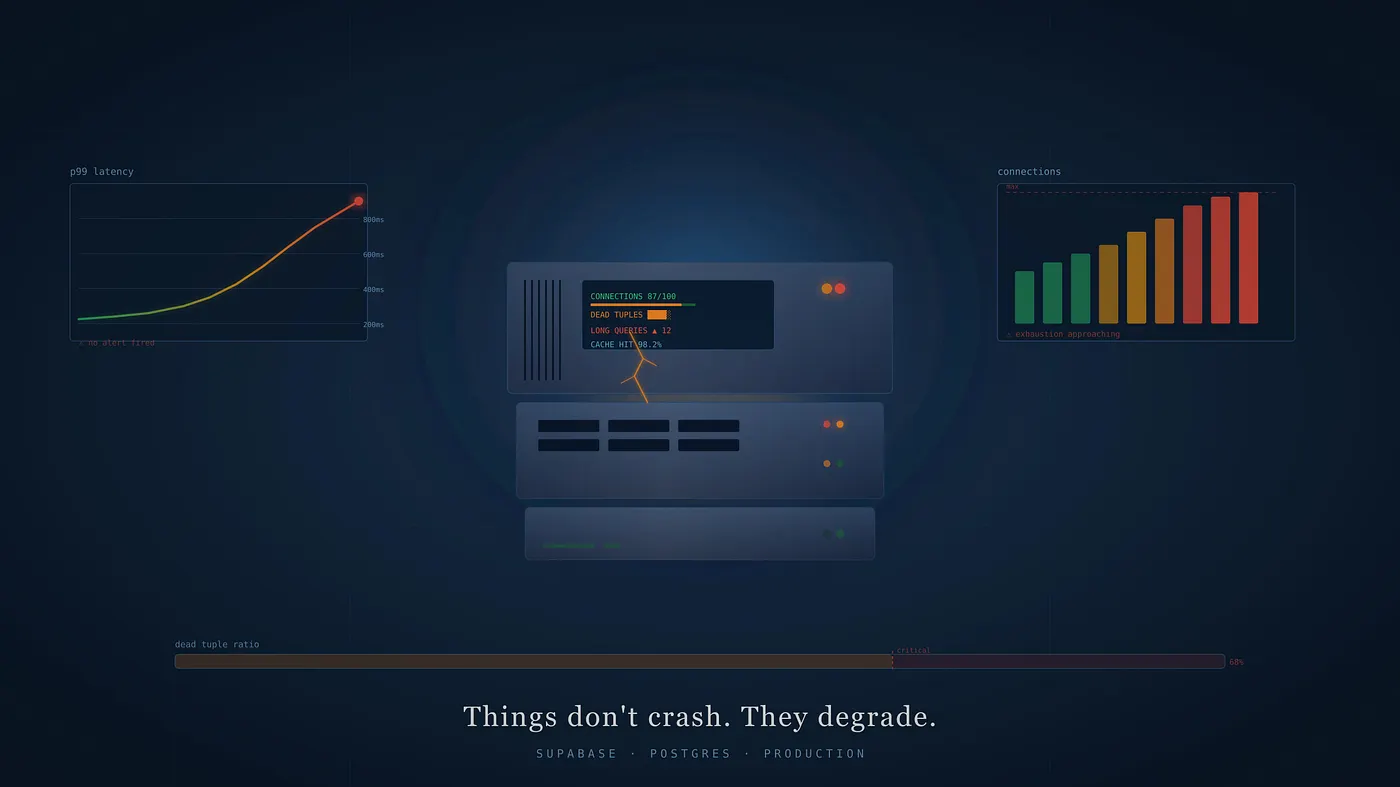
Supabase: Easy to Ship. Hard to Maintain
The same Supabase that ships us fast can slow us down in silence. Shipping is just Step One—the true shades of a product only emerge once traffic starts flowing.
Read full article