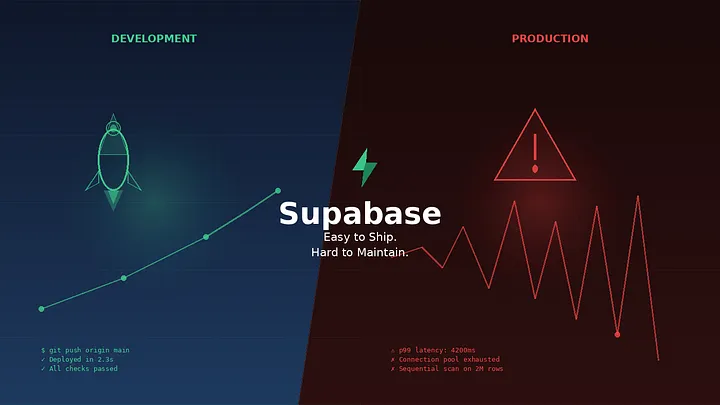
Supabase: Easy to Ship. Hard to Maintain
The same Supabase that ships us fast can slow us down in silence. Shipping is just Step One—the true shades of a product only emerge once traffic starts flowing.
In the modern founder’s toolkit, Supabase is the ultimate accelerator. Personally, we’ve replaced Firebase with Supabase for most of our projects, and it has become our default starting point for a while.
Supabase bundles the world’s most powerful database (Postgres) with everything else: Authentication, Data APIs, Edge functions, Realtime subscriptions, Storage, and Vector embeddings. It makes the “Zero to One” phase feel like magic.
Over time, experience has taught me a hard lesson: Shipping is just Step One. The true shades of a product only emerge once the traffic starts flowing.
Development vs. Production
When we are building, we optimize for velocity. We measure progress by features shipped. We move fast, we push changes quickly, we break things, and we celebrate when we hit “Live”.
But production plays by different rules. Once traffic starts flowing in, we are no longer optimizing for features; we are optimizing for stability and predictability.
Suddenly, the questions change:
- Is the system predictable?
- Are users seeing consistent performance?
- Can we handle growth without surprises?
Development hides complexity. Production exposes it.
Postgres: Great Power with Responsibility
Supabase, being built on Postgres, is both its greatest strength and its most underappreciated responsibility. Postgres is genuinely extraordinary—it’s powerful and reliable. But once we’re live, we start seeing the other side of that power: operational responsibility.
When our application is live, we need answers to questions that don’t show up during development, and a standard dashboard doesn’t always warn us:
- Are there missing indexes slowing down the 99th percentile of users?
- Are long-running queries blocking others?
- Do we have connection saturation?
- Is table bloat accumulating over time, thereby throttling performance?
- Are locks affecting performance?
We learned this the hard way. Six months after launch, our p99 response times had been silently climbing for weeks. No alert had fired. We dug in and found a missing index on a query that ran perfectly during testing with a few hundred rows, but was doing a full sequential scan across two million rows in production.
Nobody warned us. We just happened to look.
Most of the time, we handle these things reactively. We either wait for a user to complain or for the application to go down.
The Reactive Pattern
If we’re honest, the default operating mode for most early-stage teams is reactive. We respond to fires instead of preventing them. Not because we’re careless, but because when we’re moving fast, monitoring feels like a “later” problem.
And “later” has a way of arriving without warning.
This is what I’ve come to think of as the Operational Maturity Gap. It’s not a code problem or a product problem. It’s the gap between a system that was built to ship and a system that was built to run.
Most startups fall into it somewhere between their first thousand users and their first serious incident.
Stability is the Ultimate Feature
Users don’t care about our stack. They care if it works, if it’s fast, if it’s reliable. To retain users on our platform, we have to move beyond just managed services.
We need consolidated visibility. We need to know how our platform is behaving before the bottleneck becomes a crash. We need to measure confidence.
Shipping fast is a competitive advantage. But staying stable is how we actually build trust—and trust is what builds a business.
This is exactly why we built pgpulse. Real-time observability for Supabase, so you catch the silent killers before your users do.
Share this article
Found this useful? Spread the word so more Supabase teams can optimize their observability stack.